European Election results mapped by Degree of Urbanization

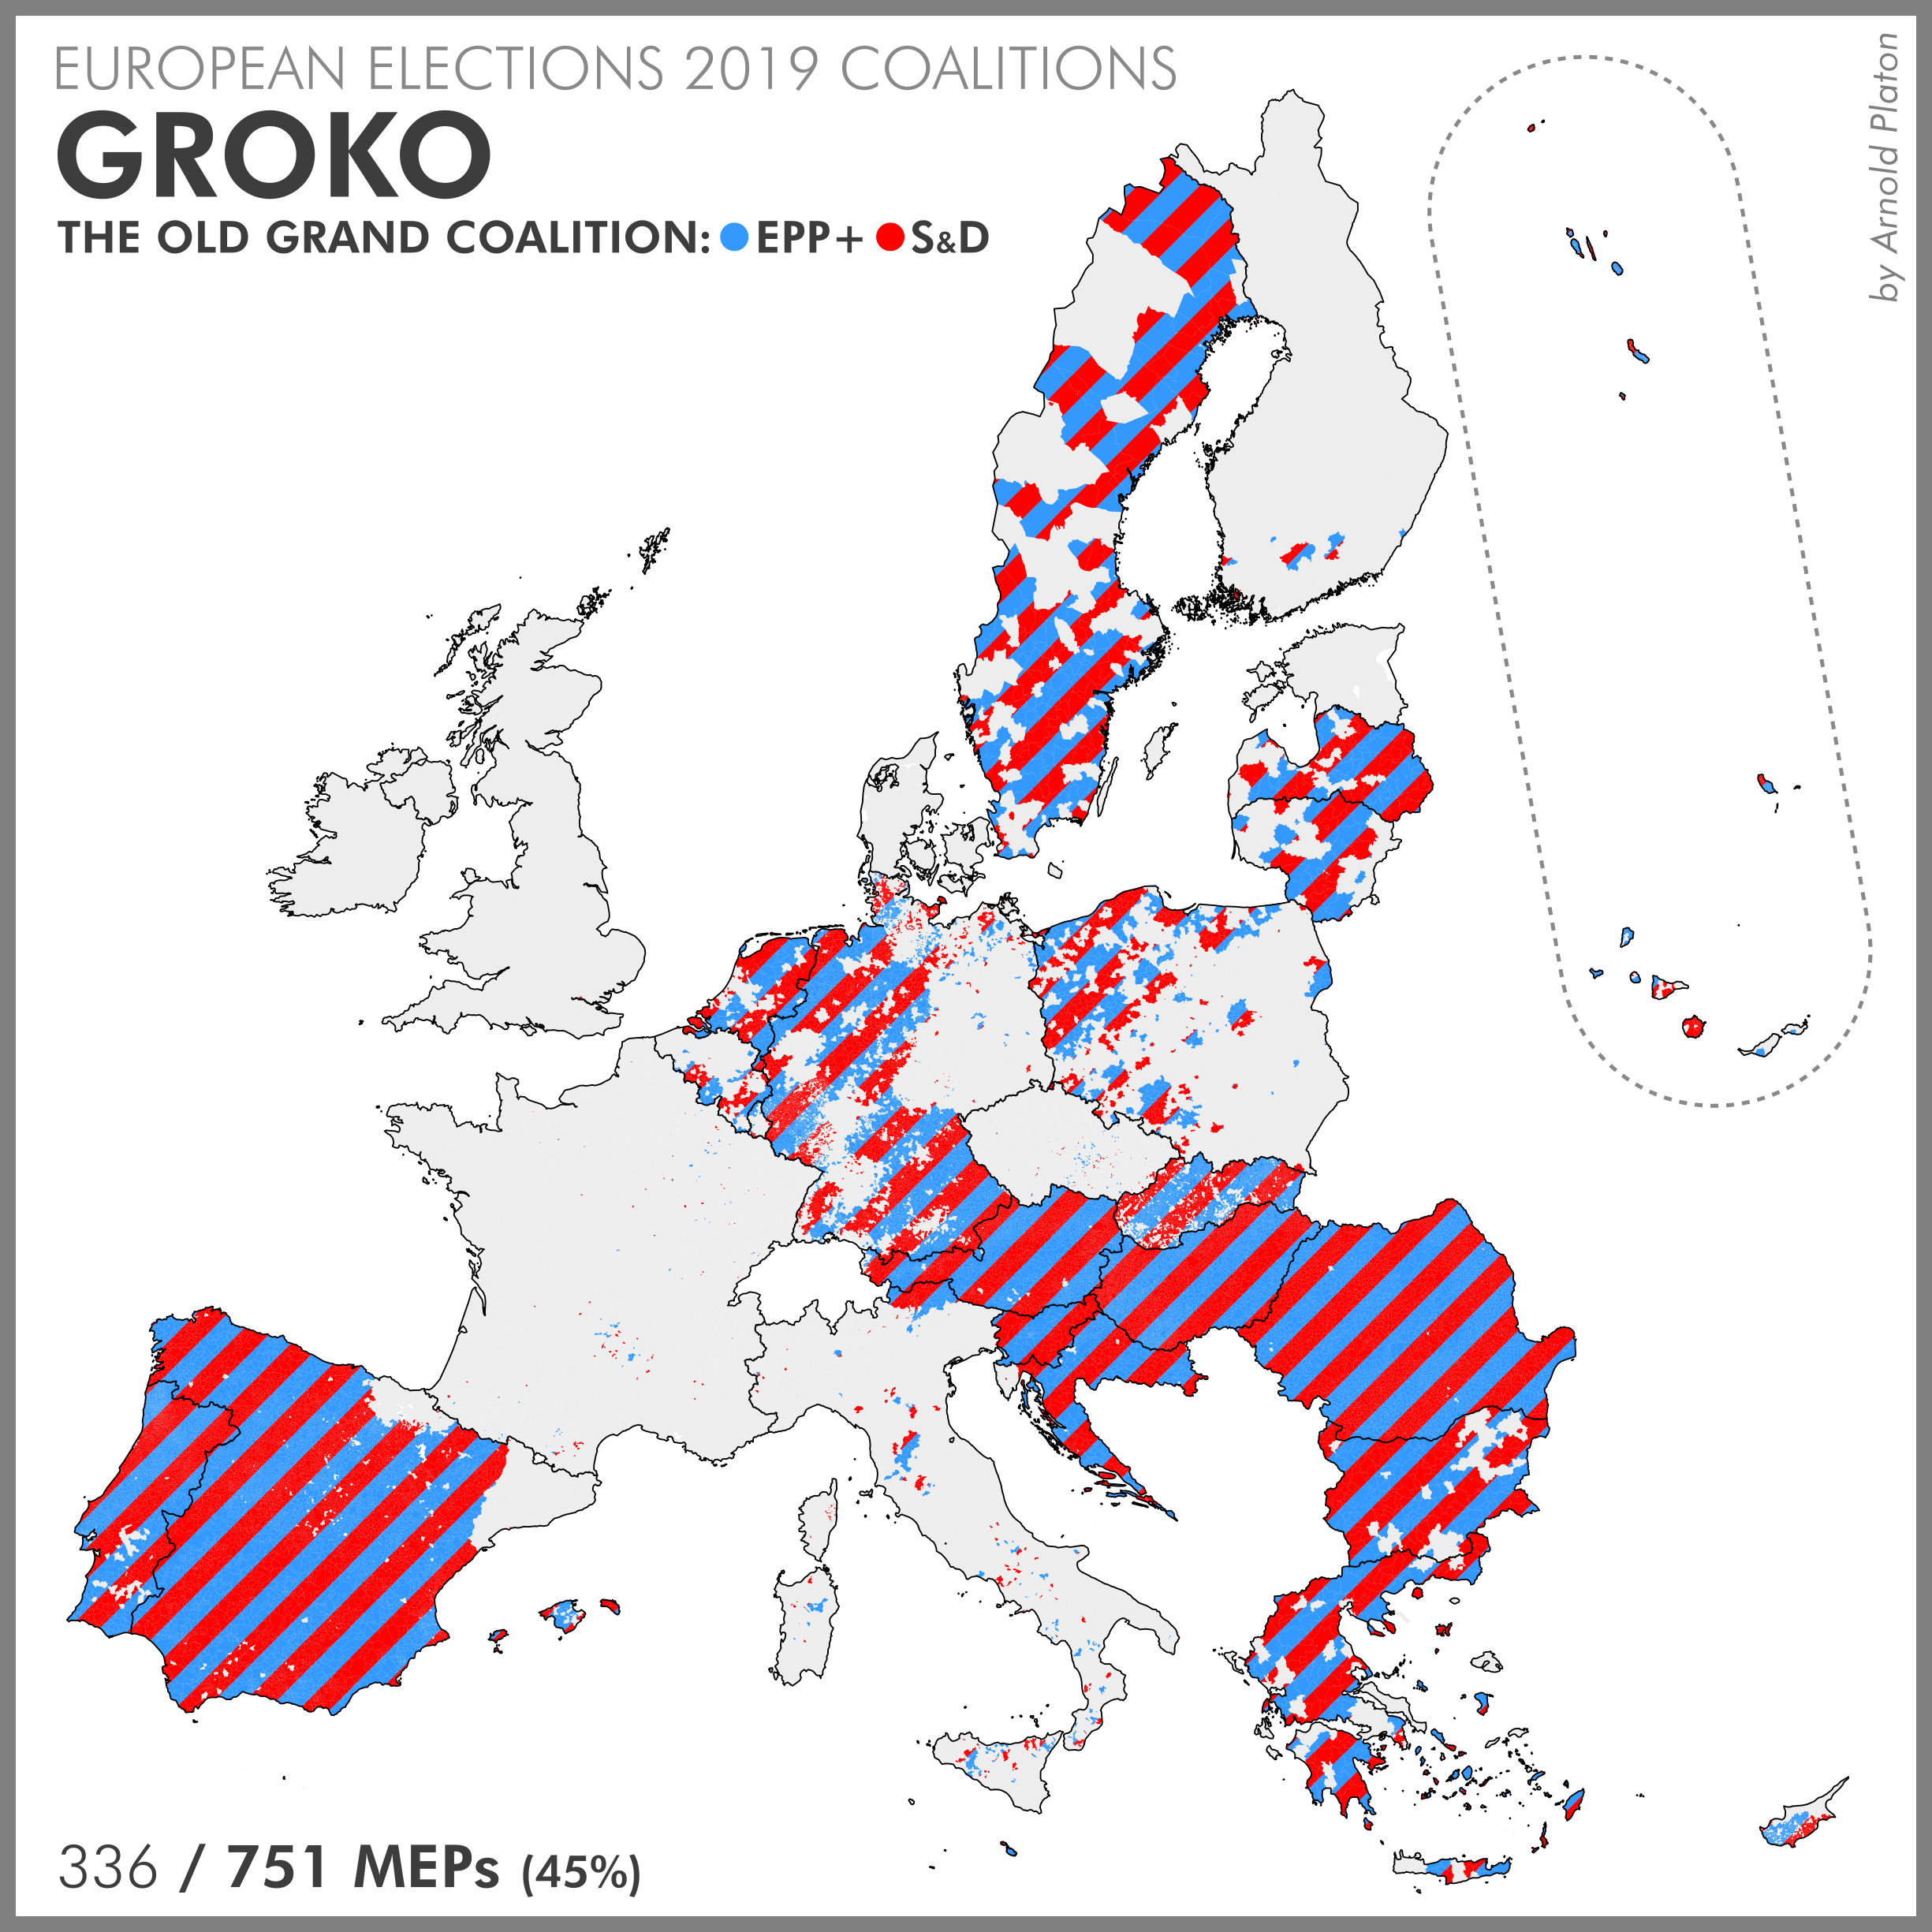
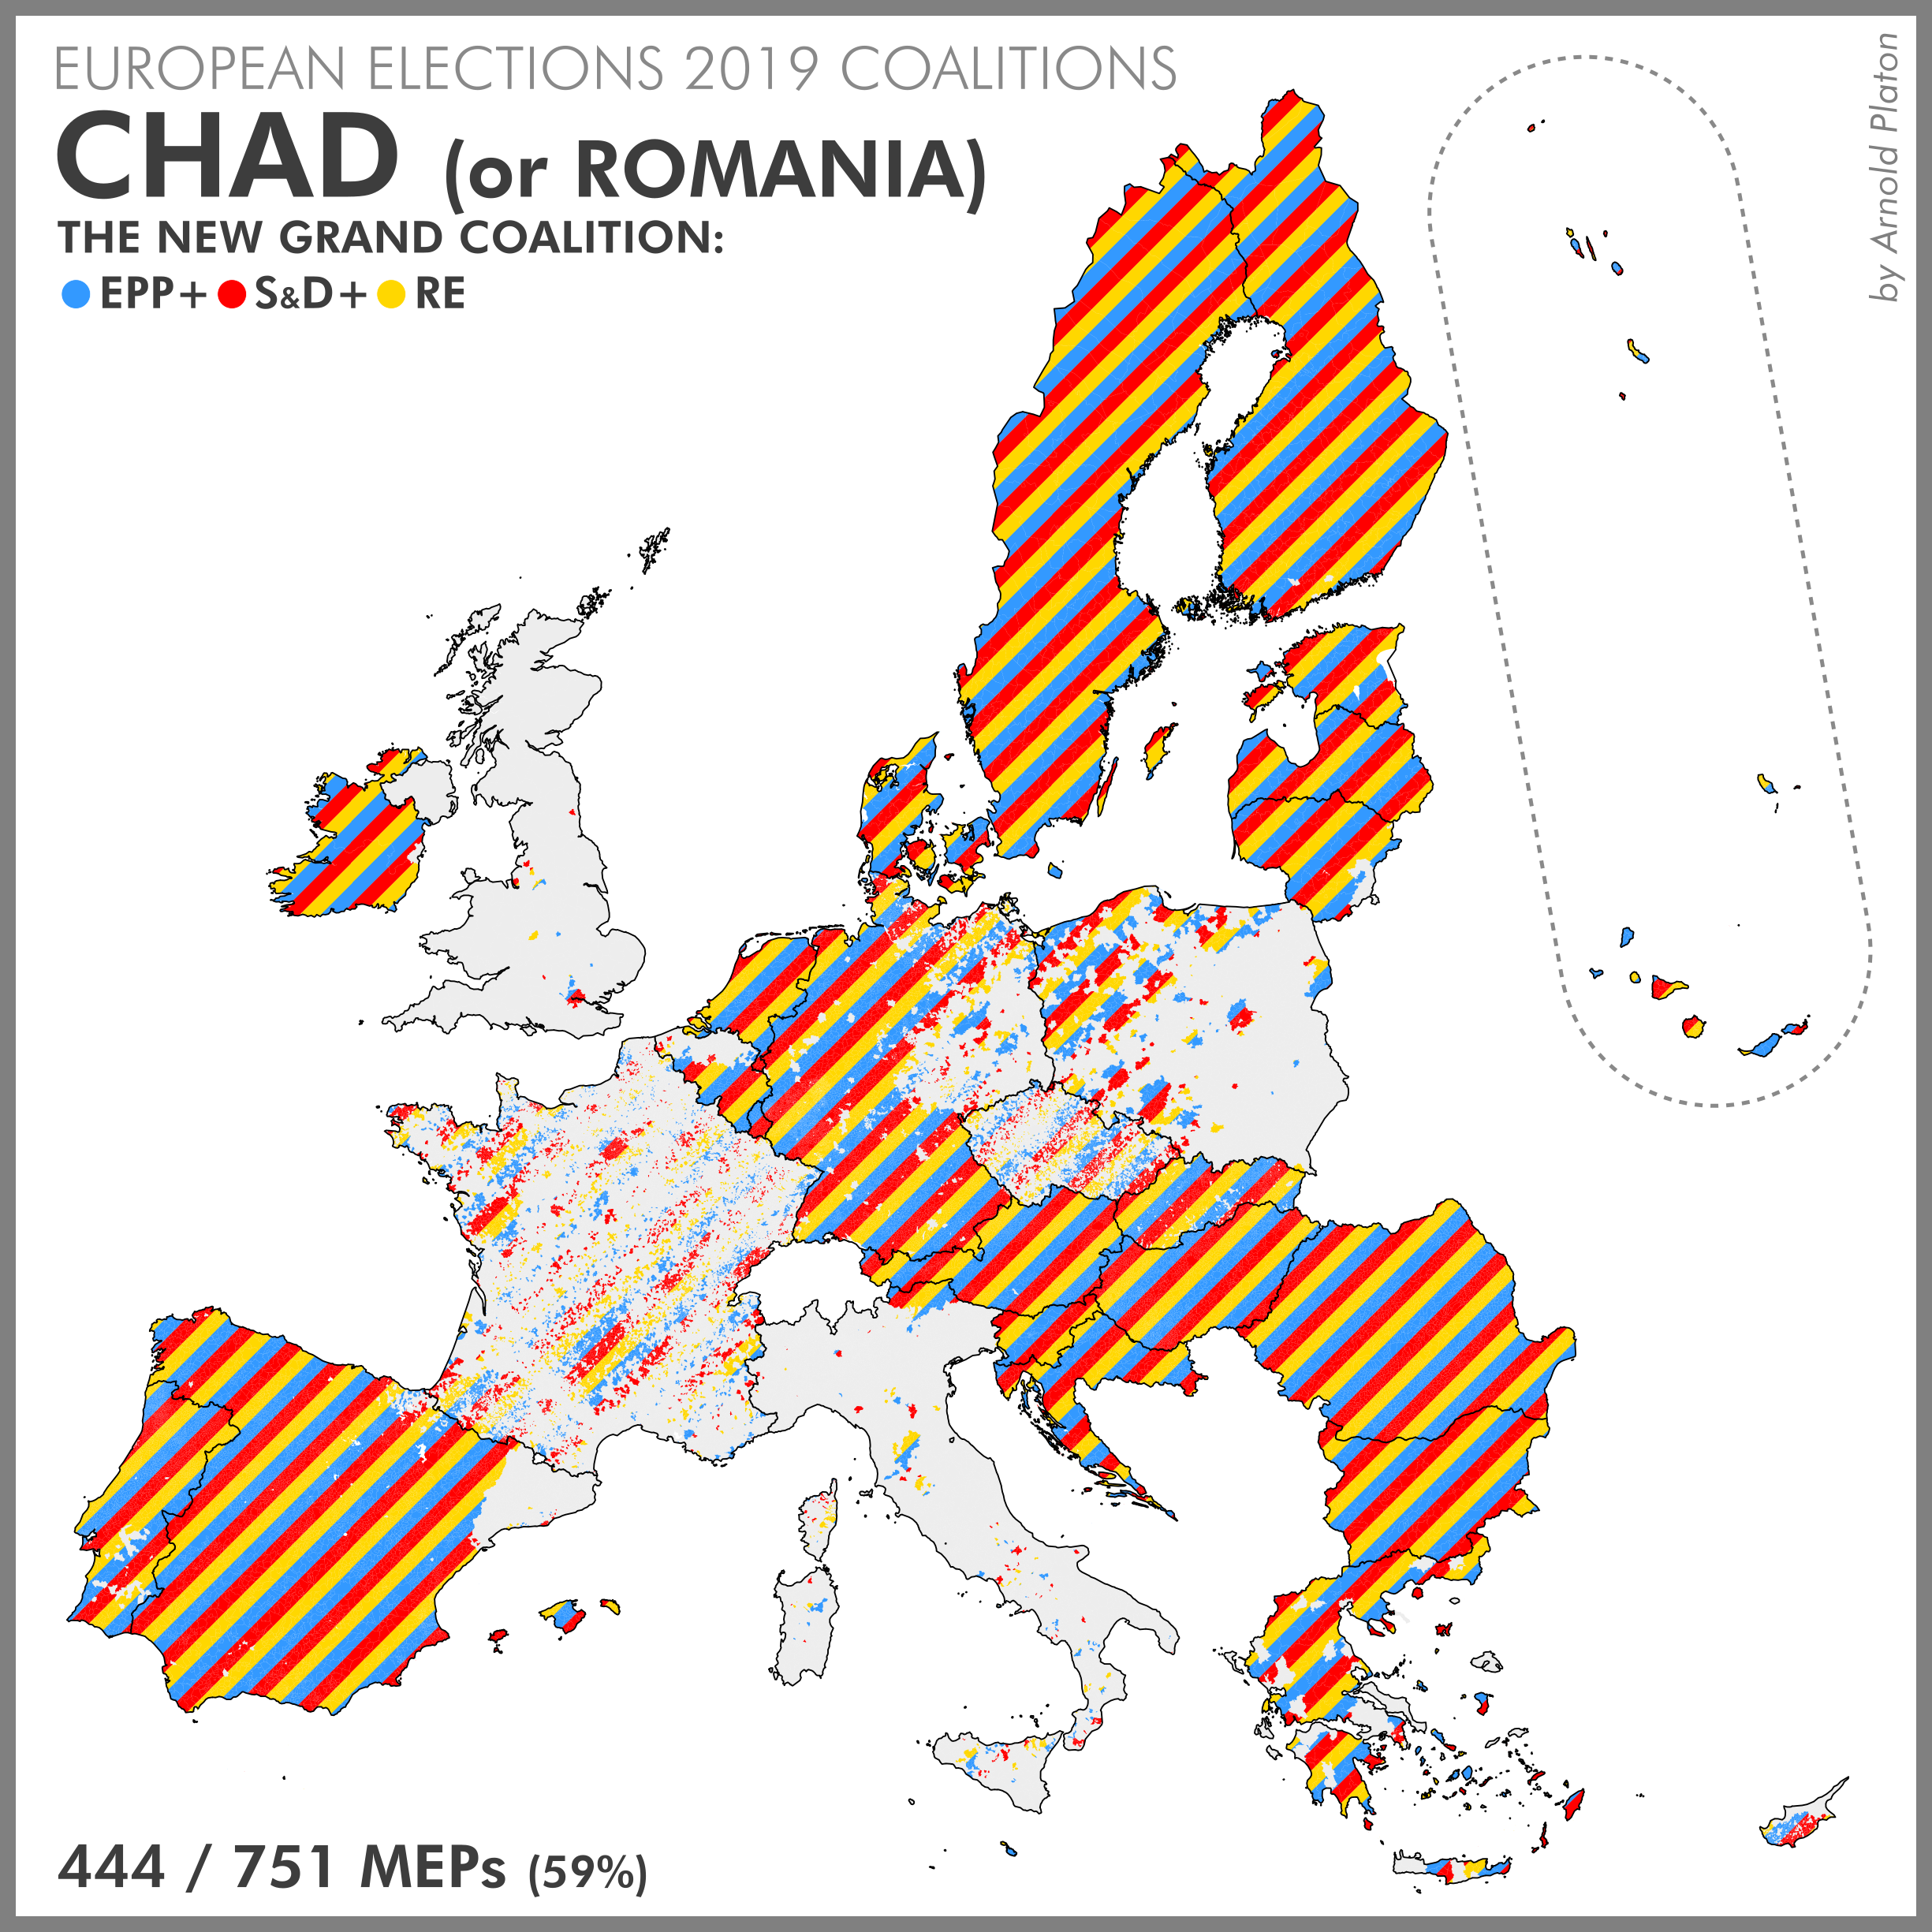
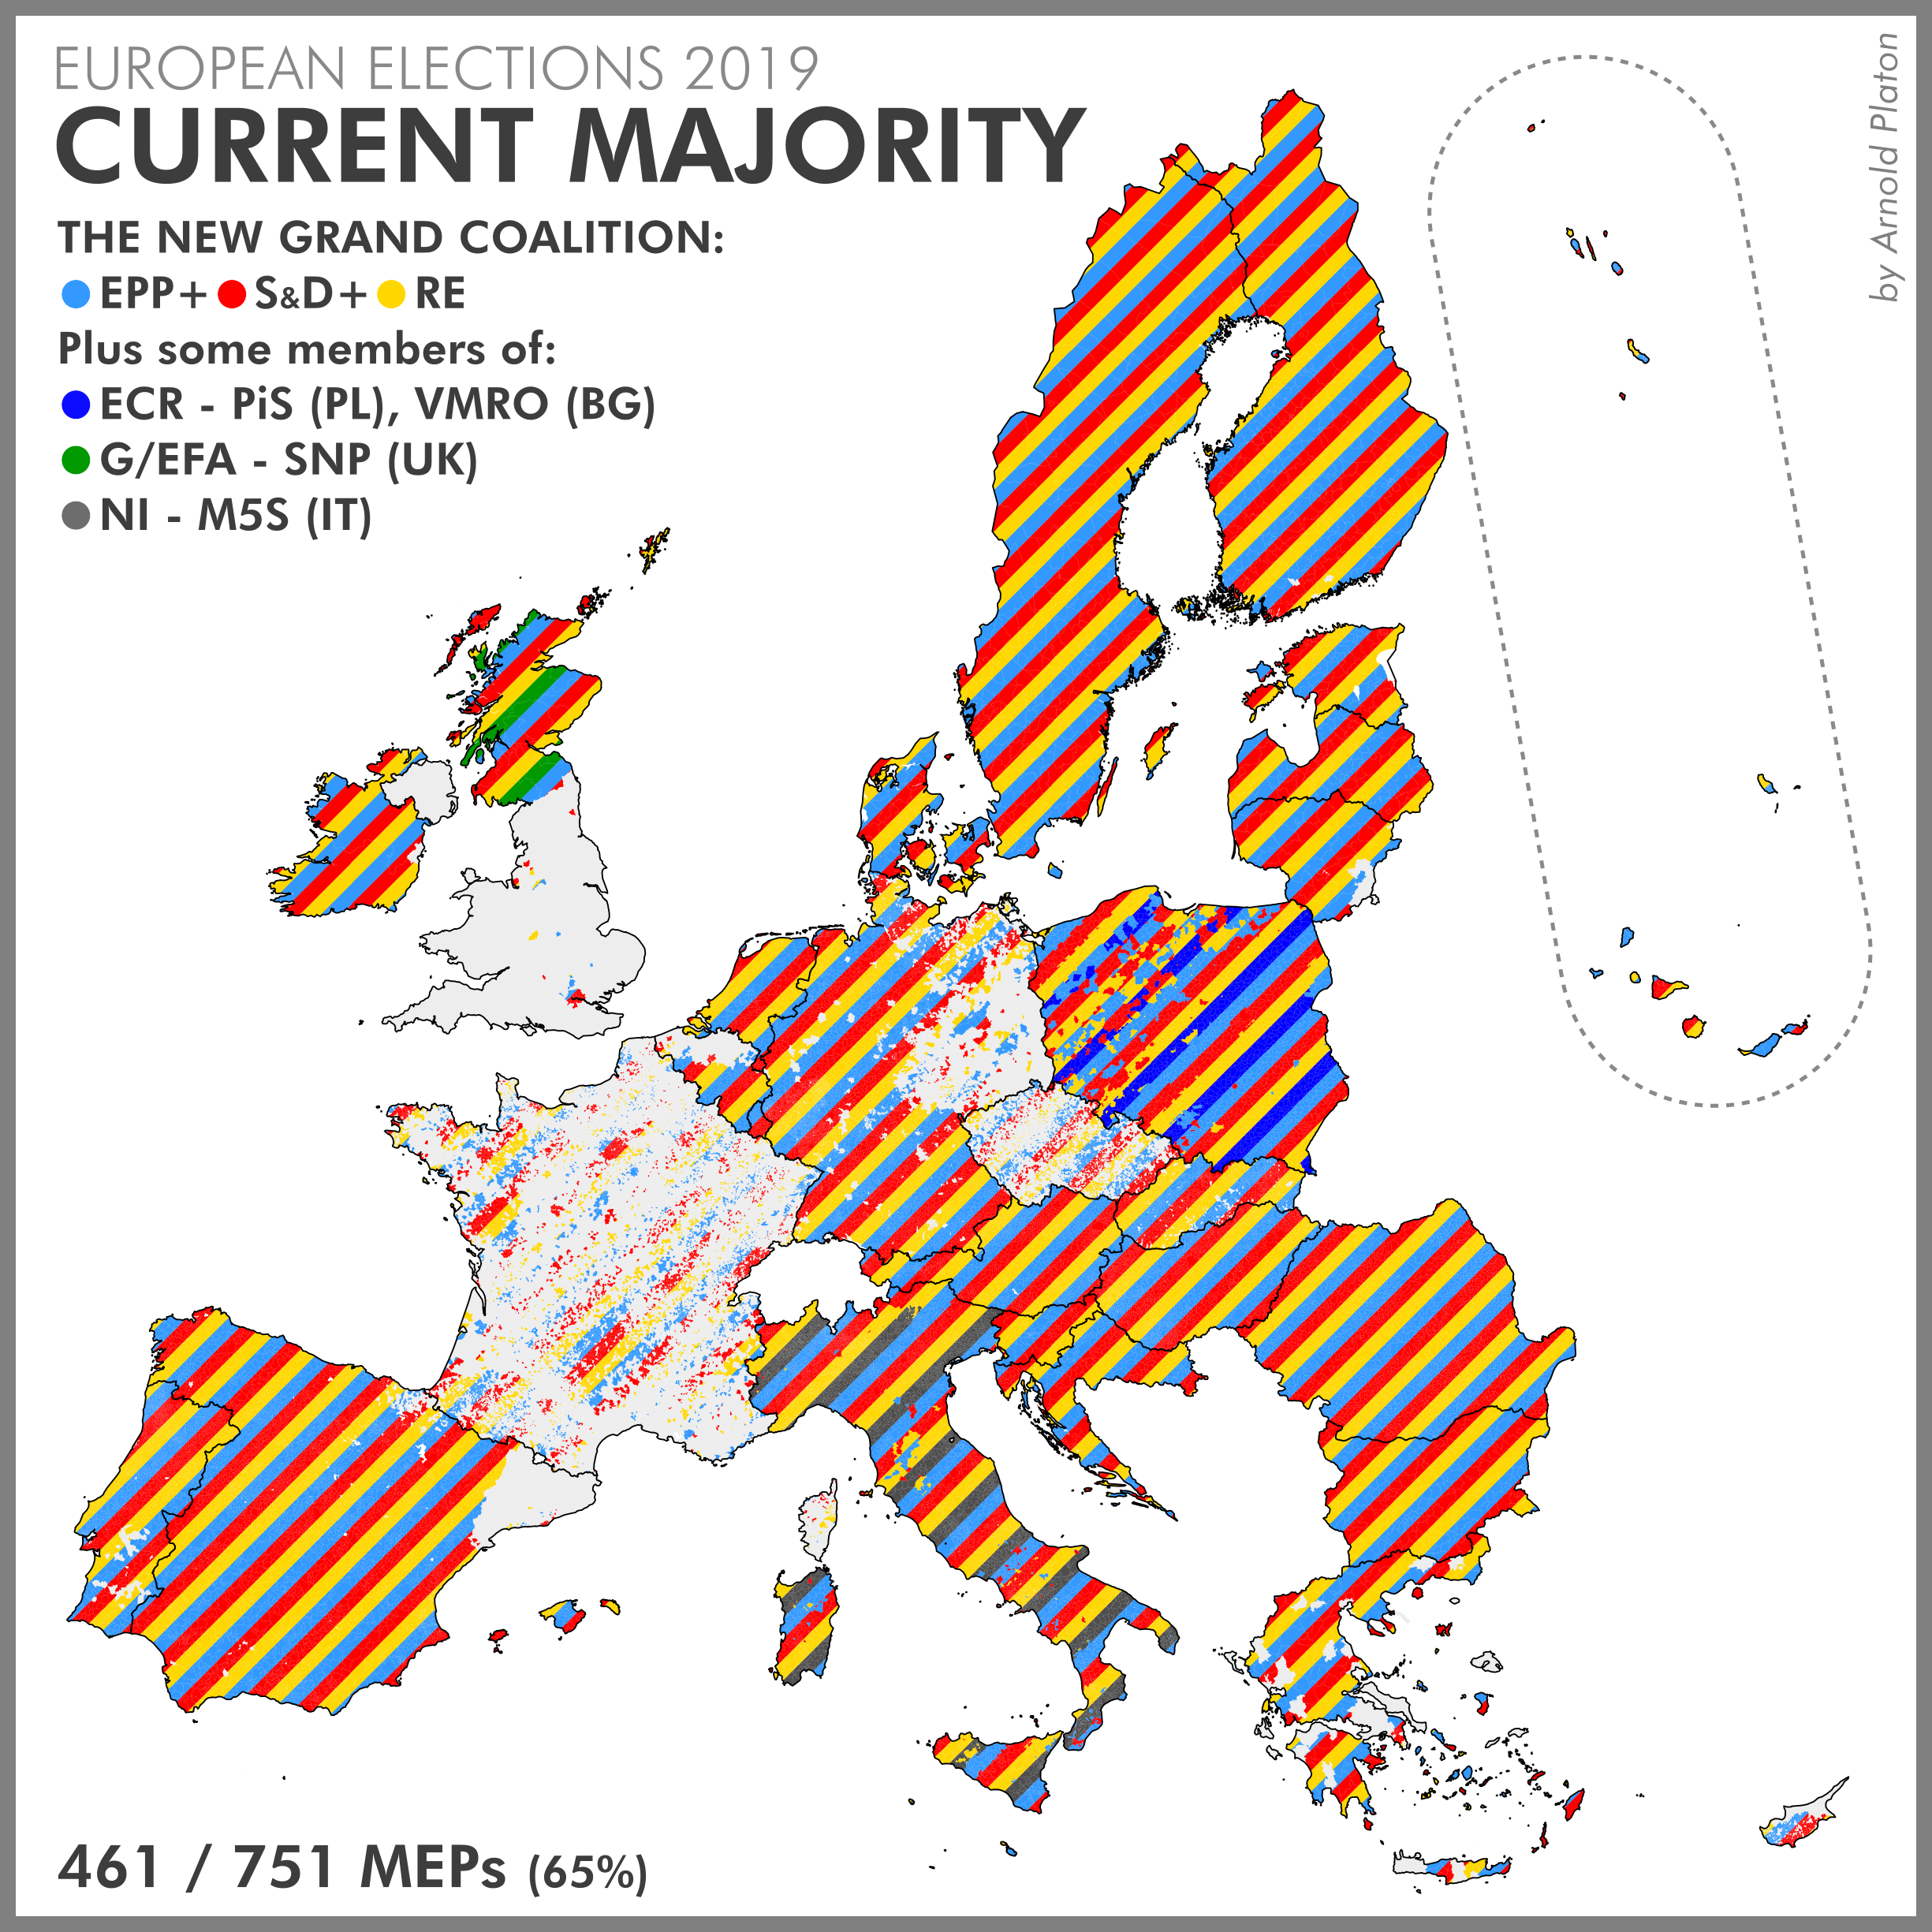
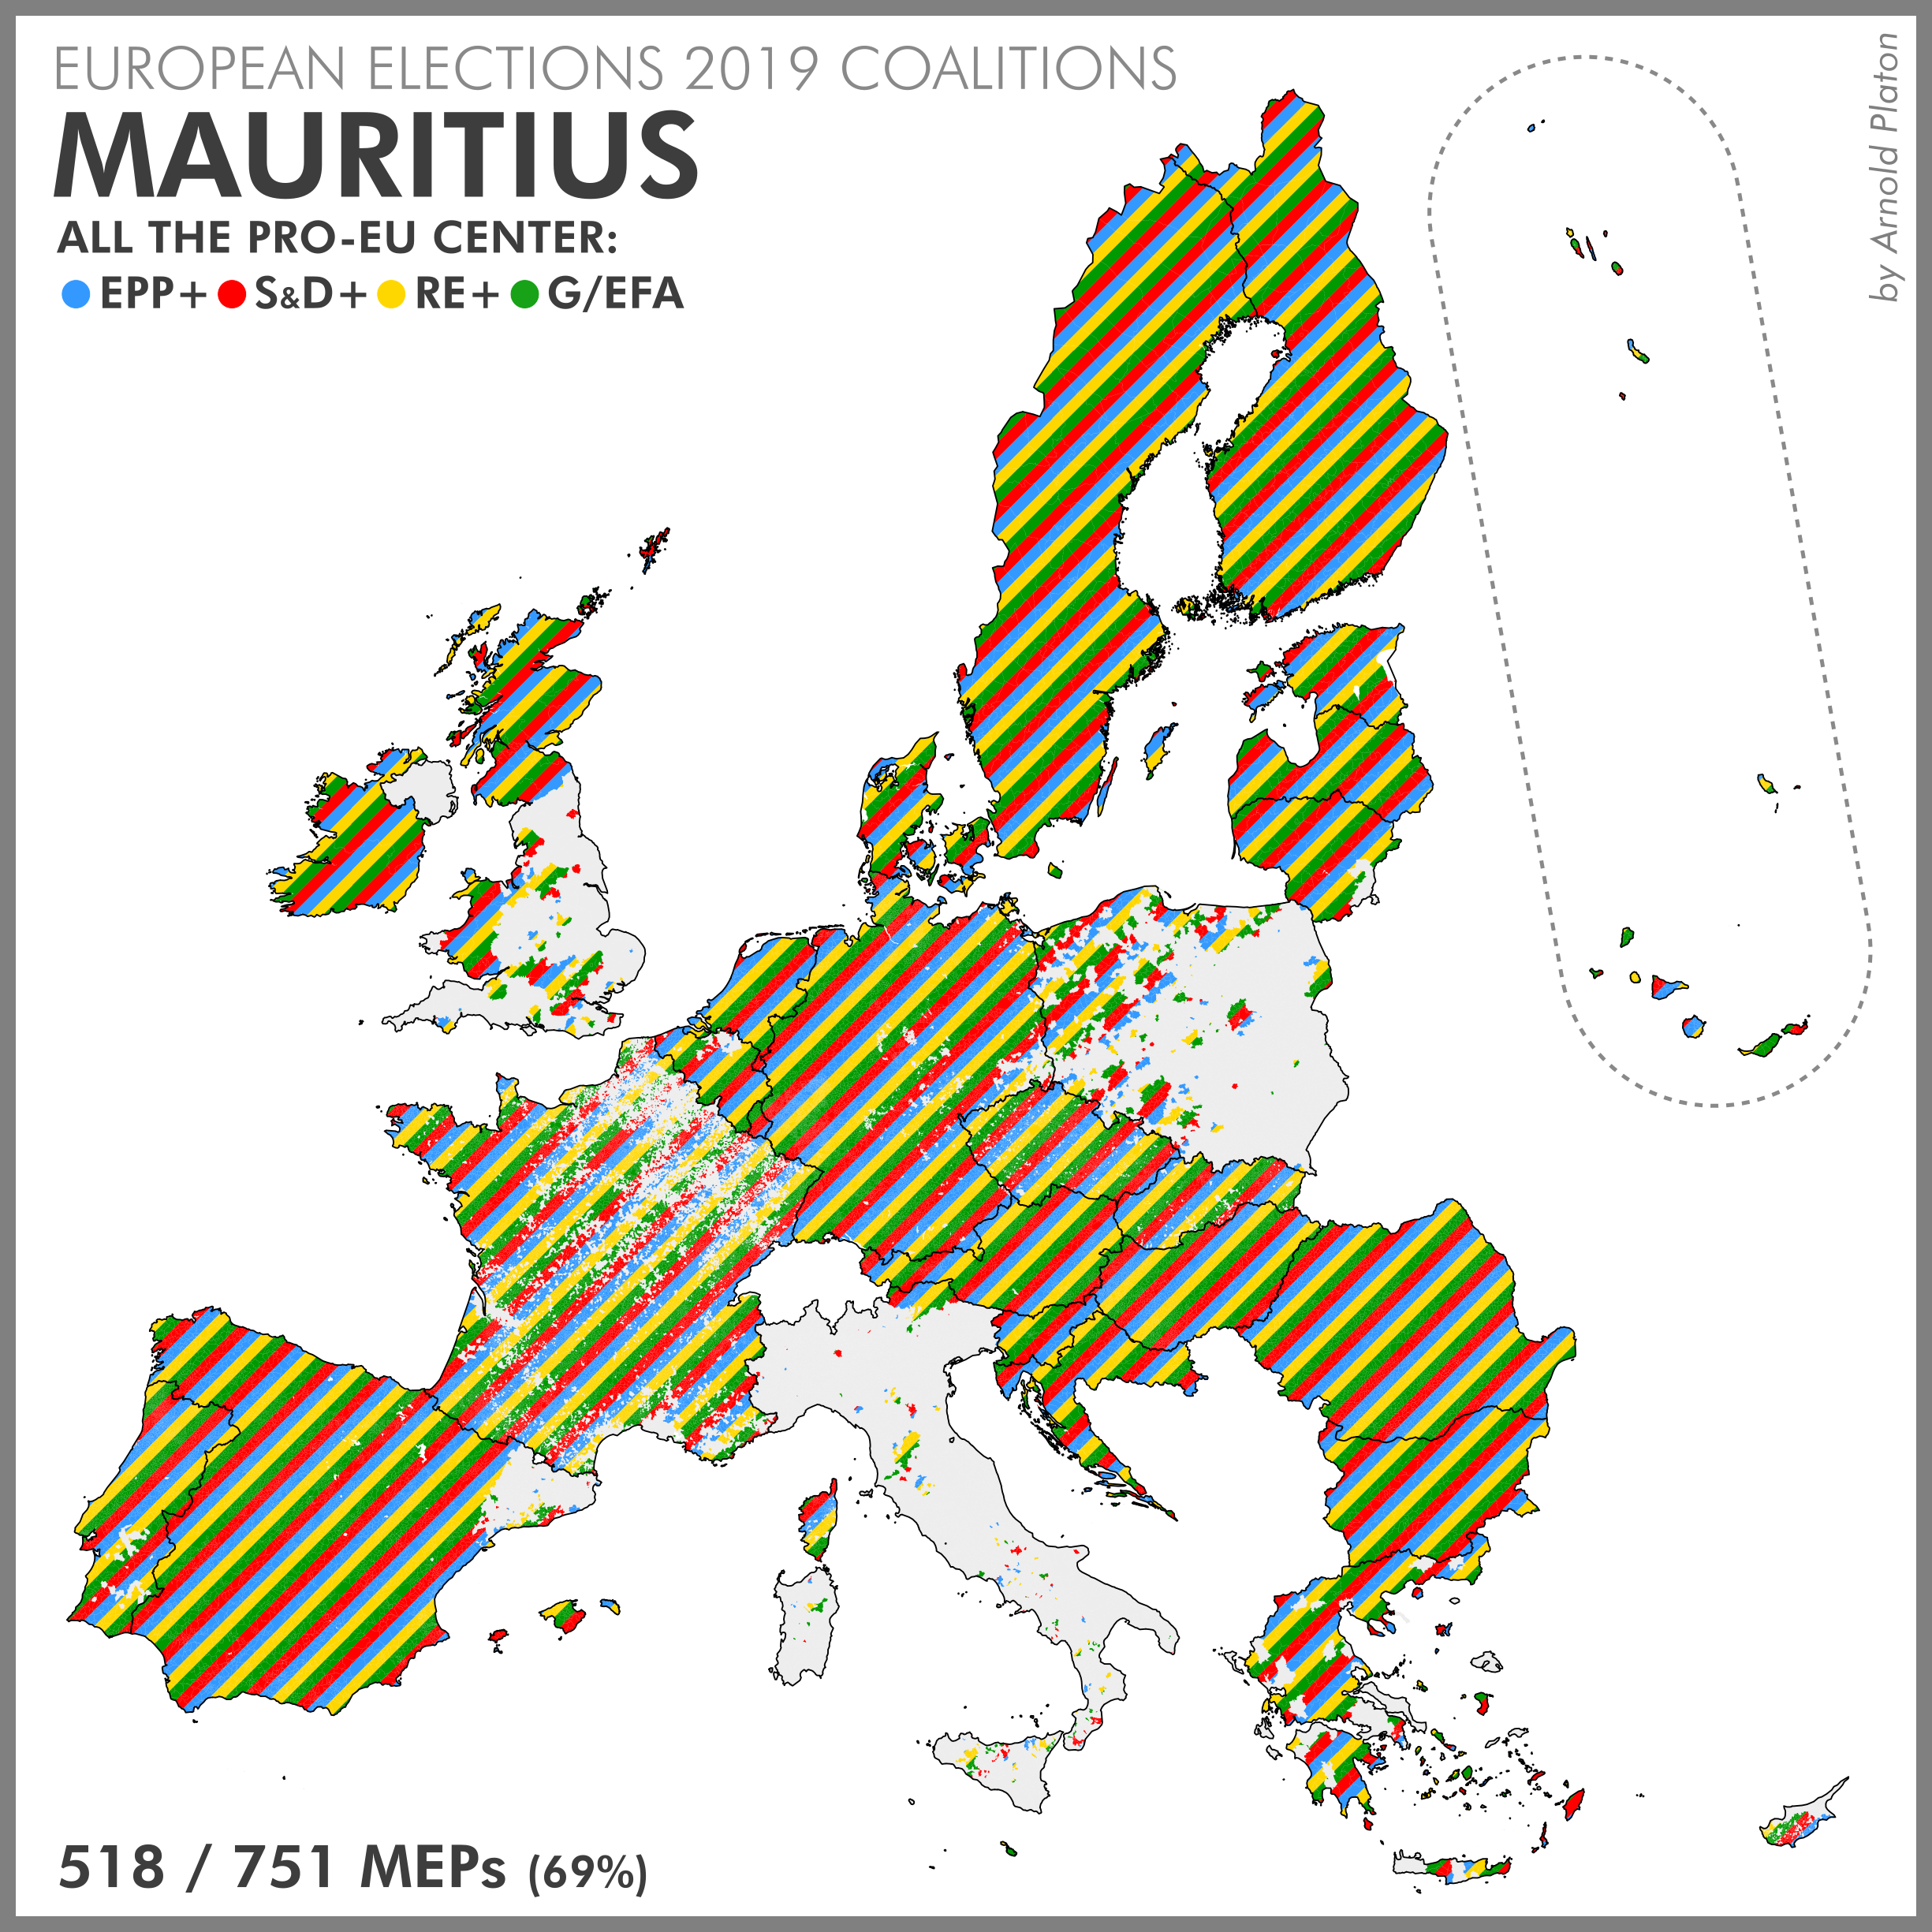
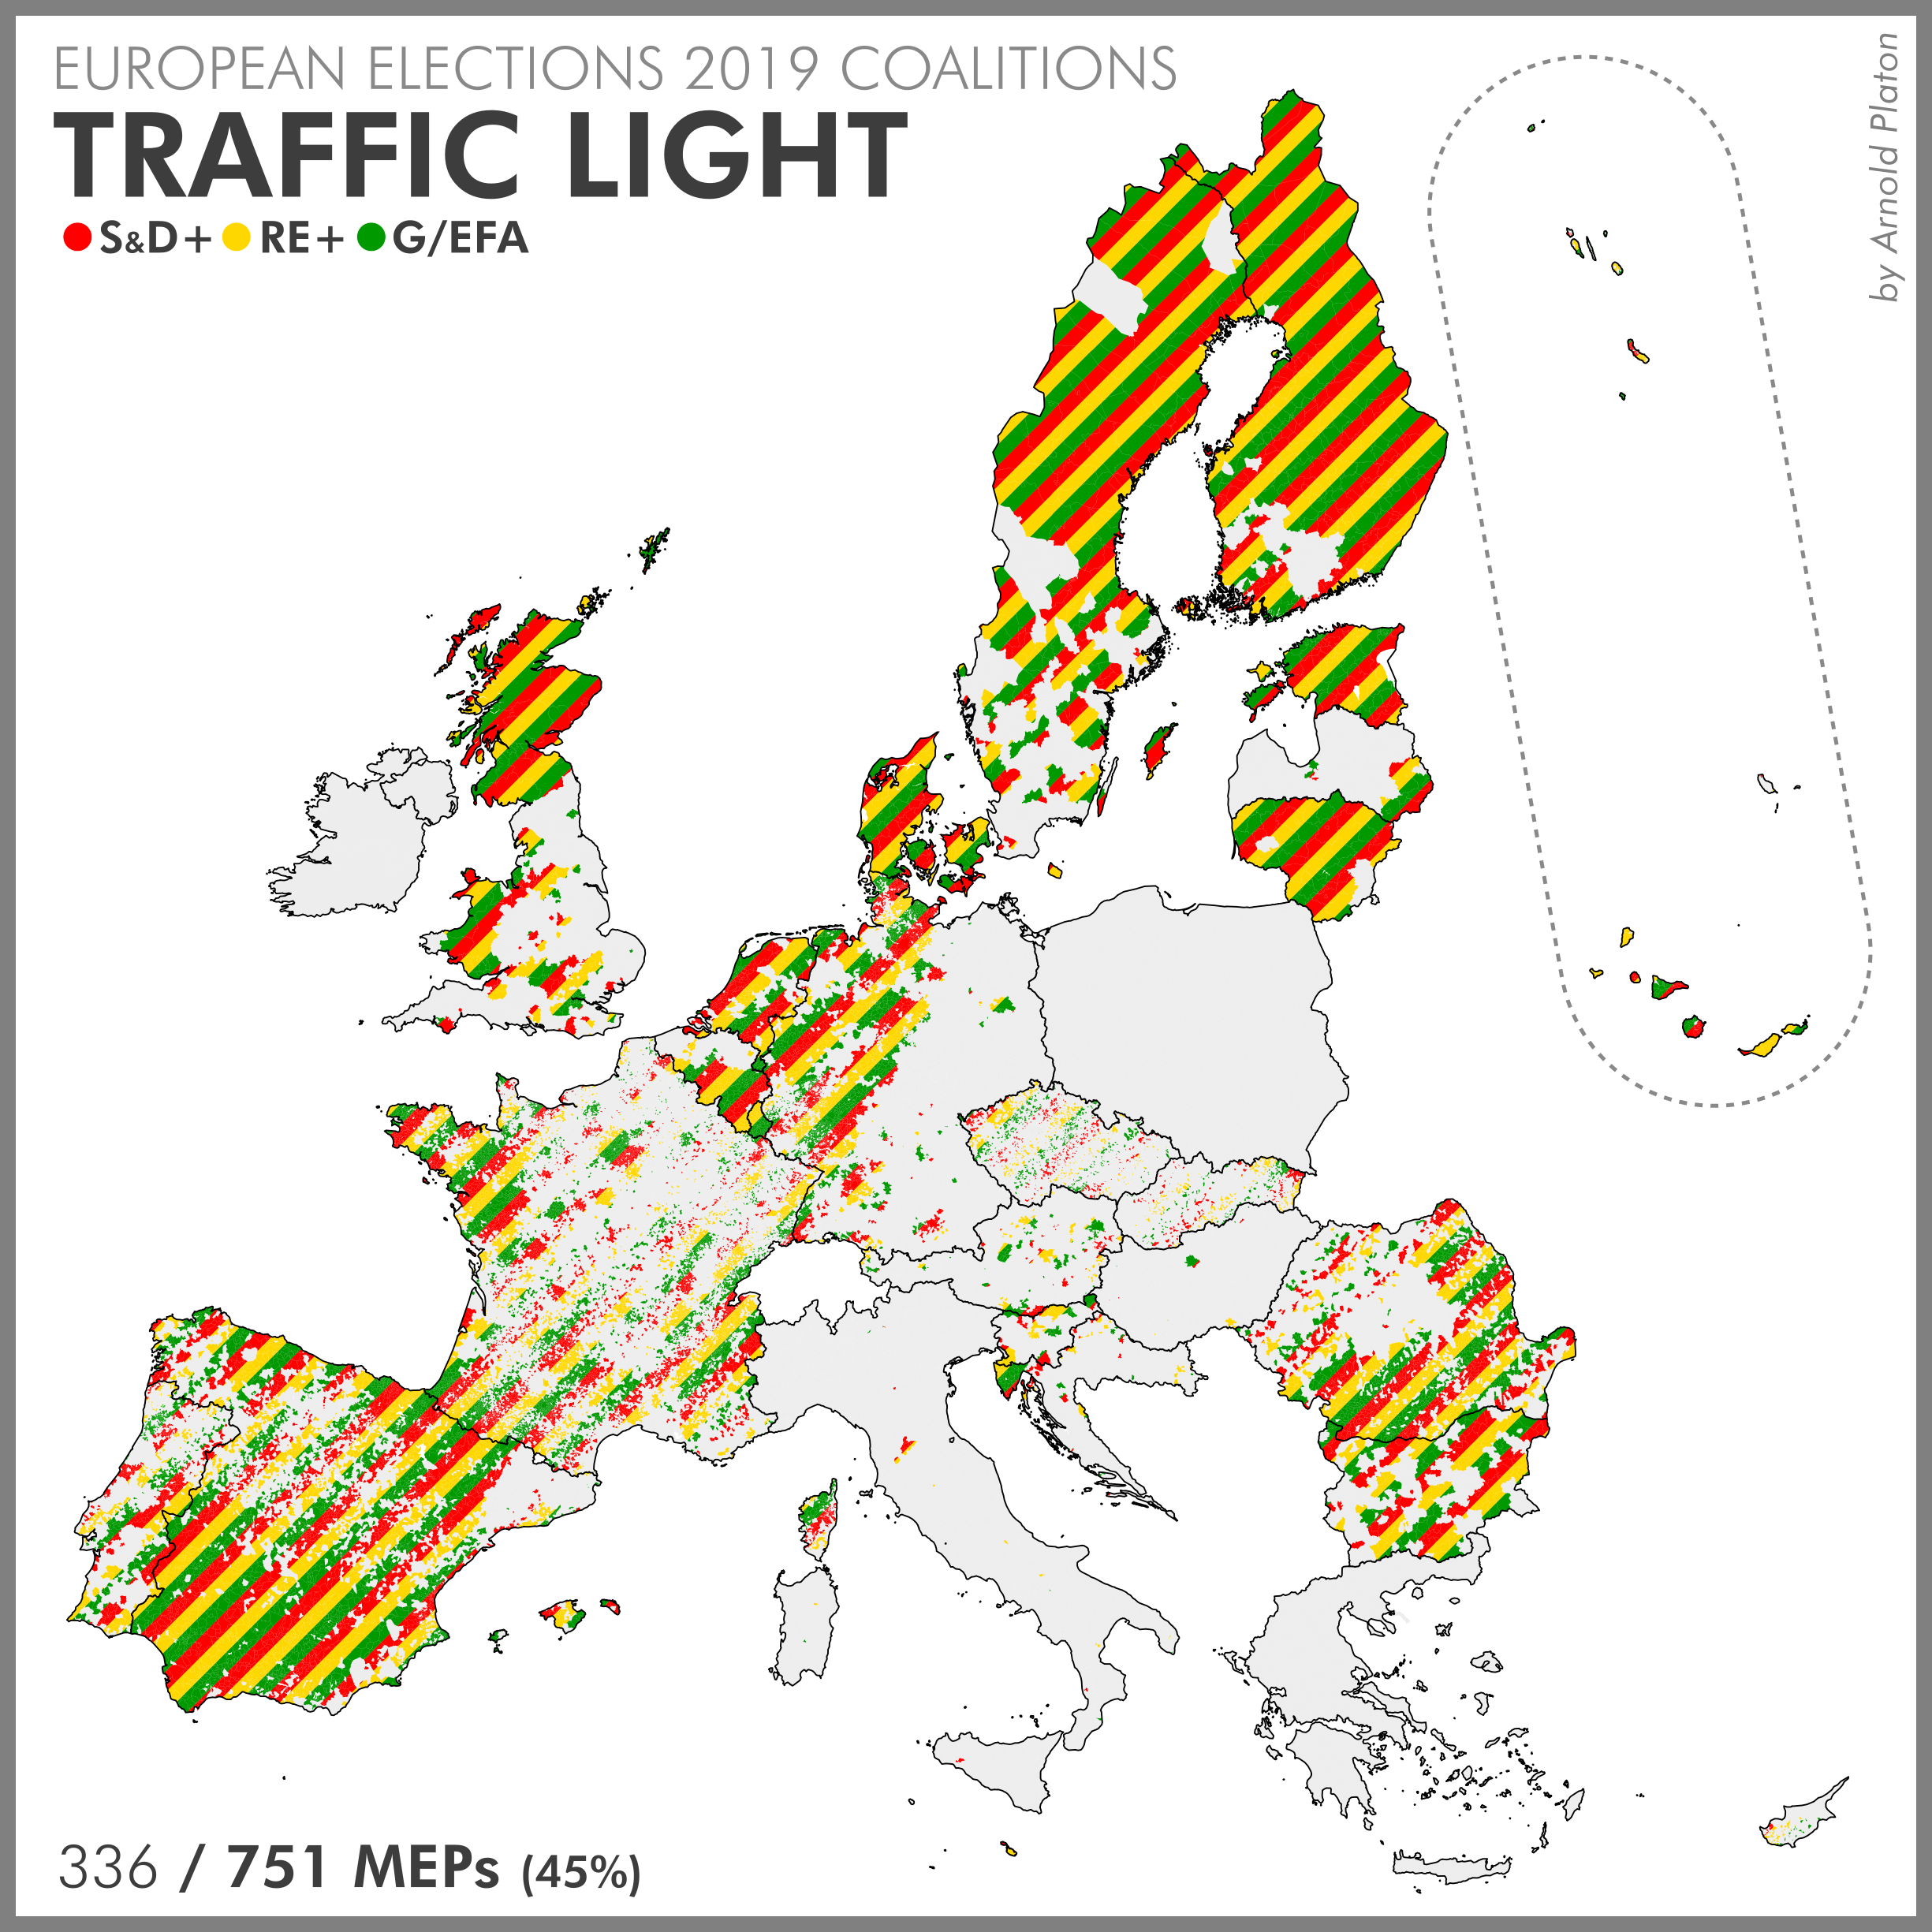
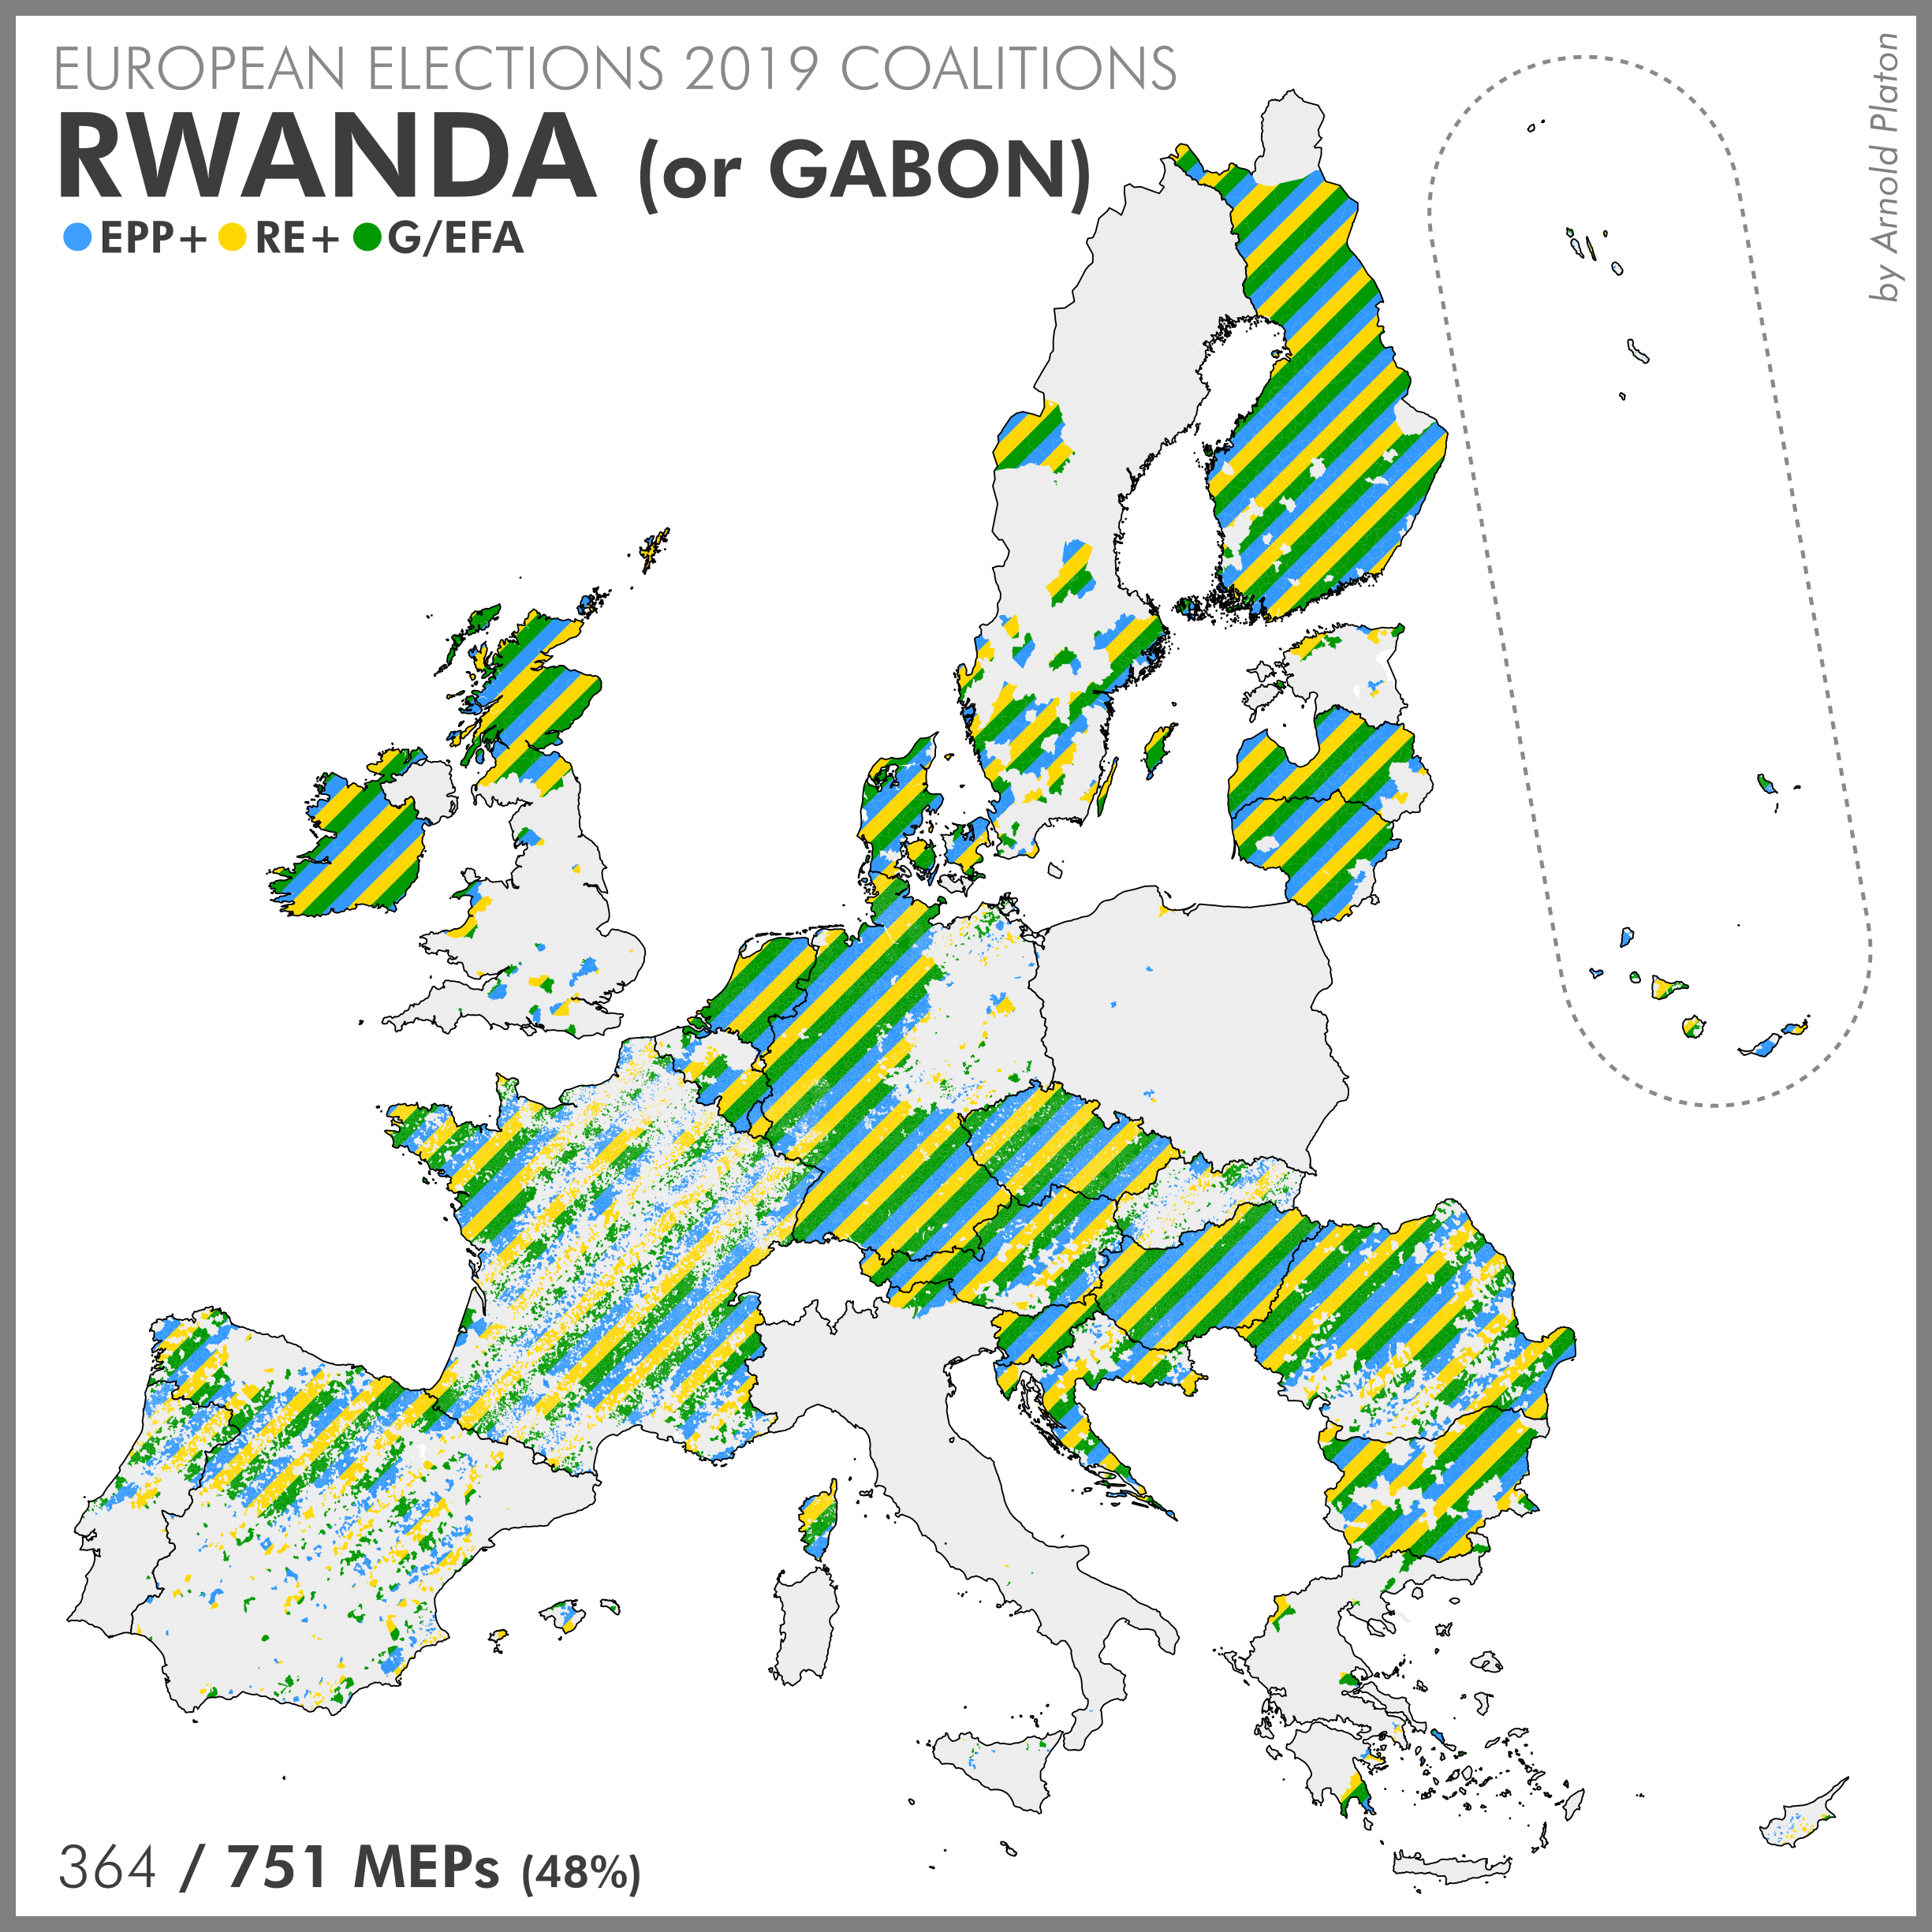
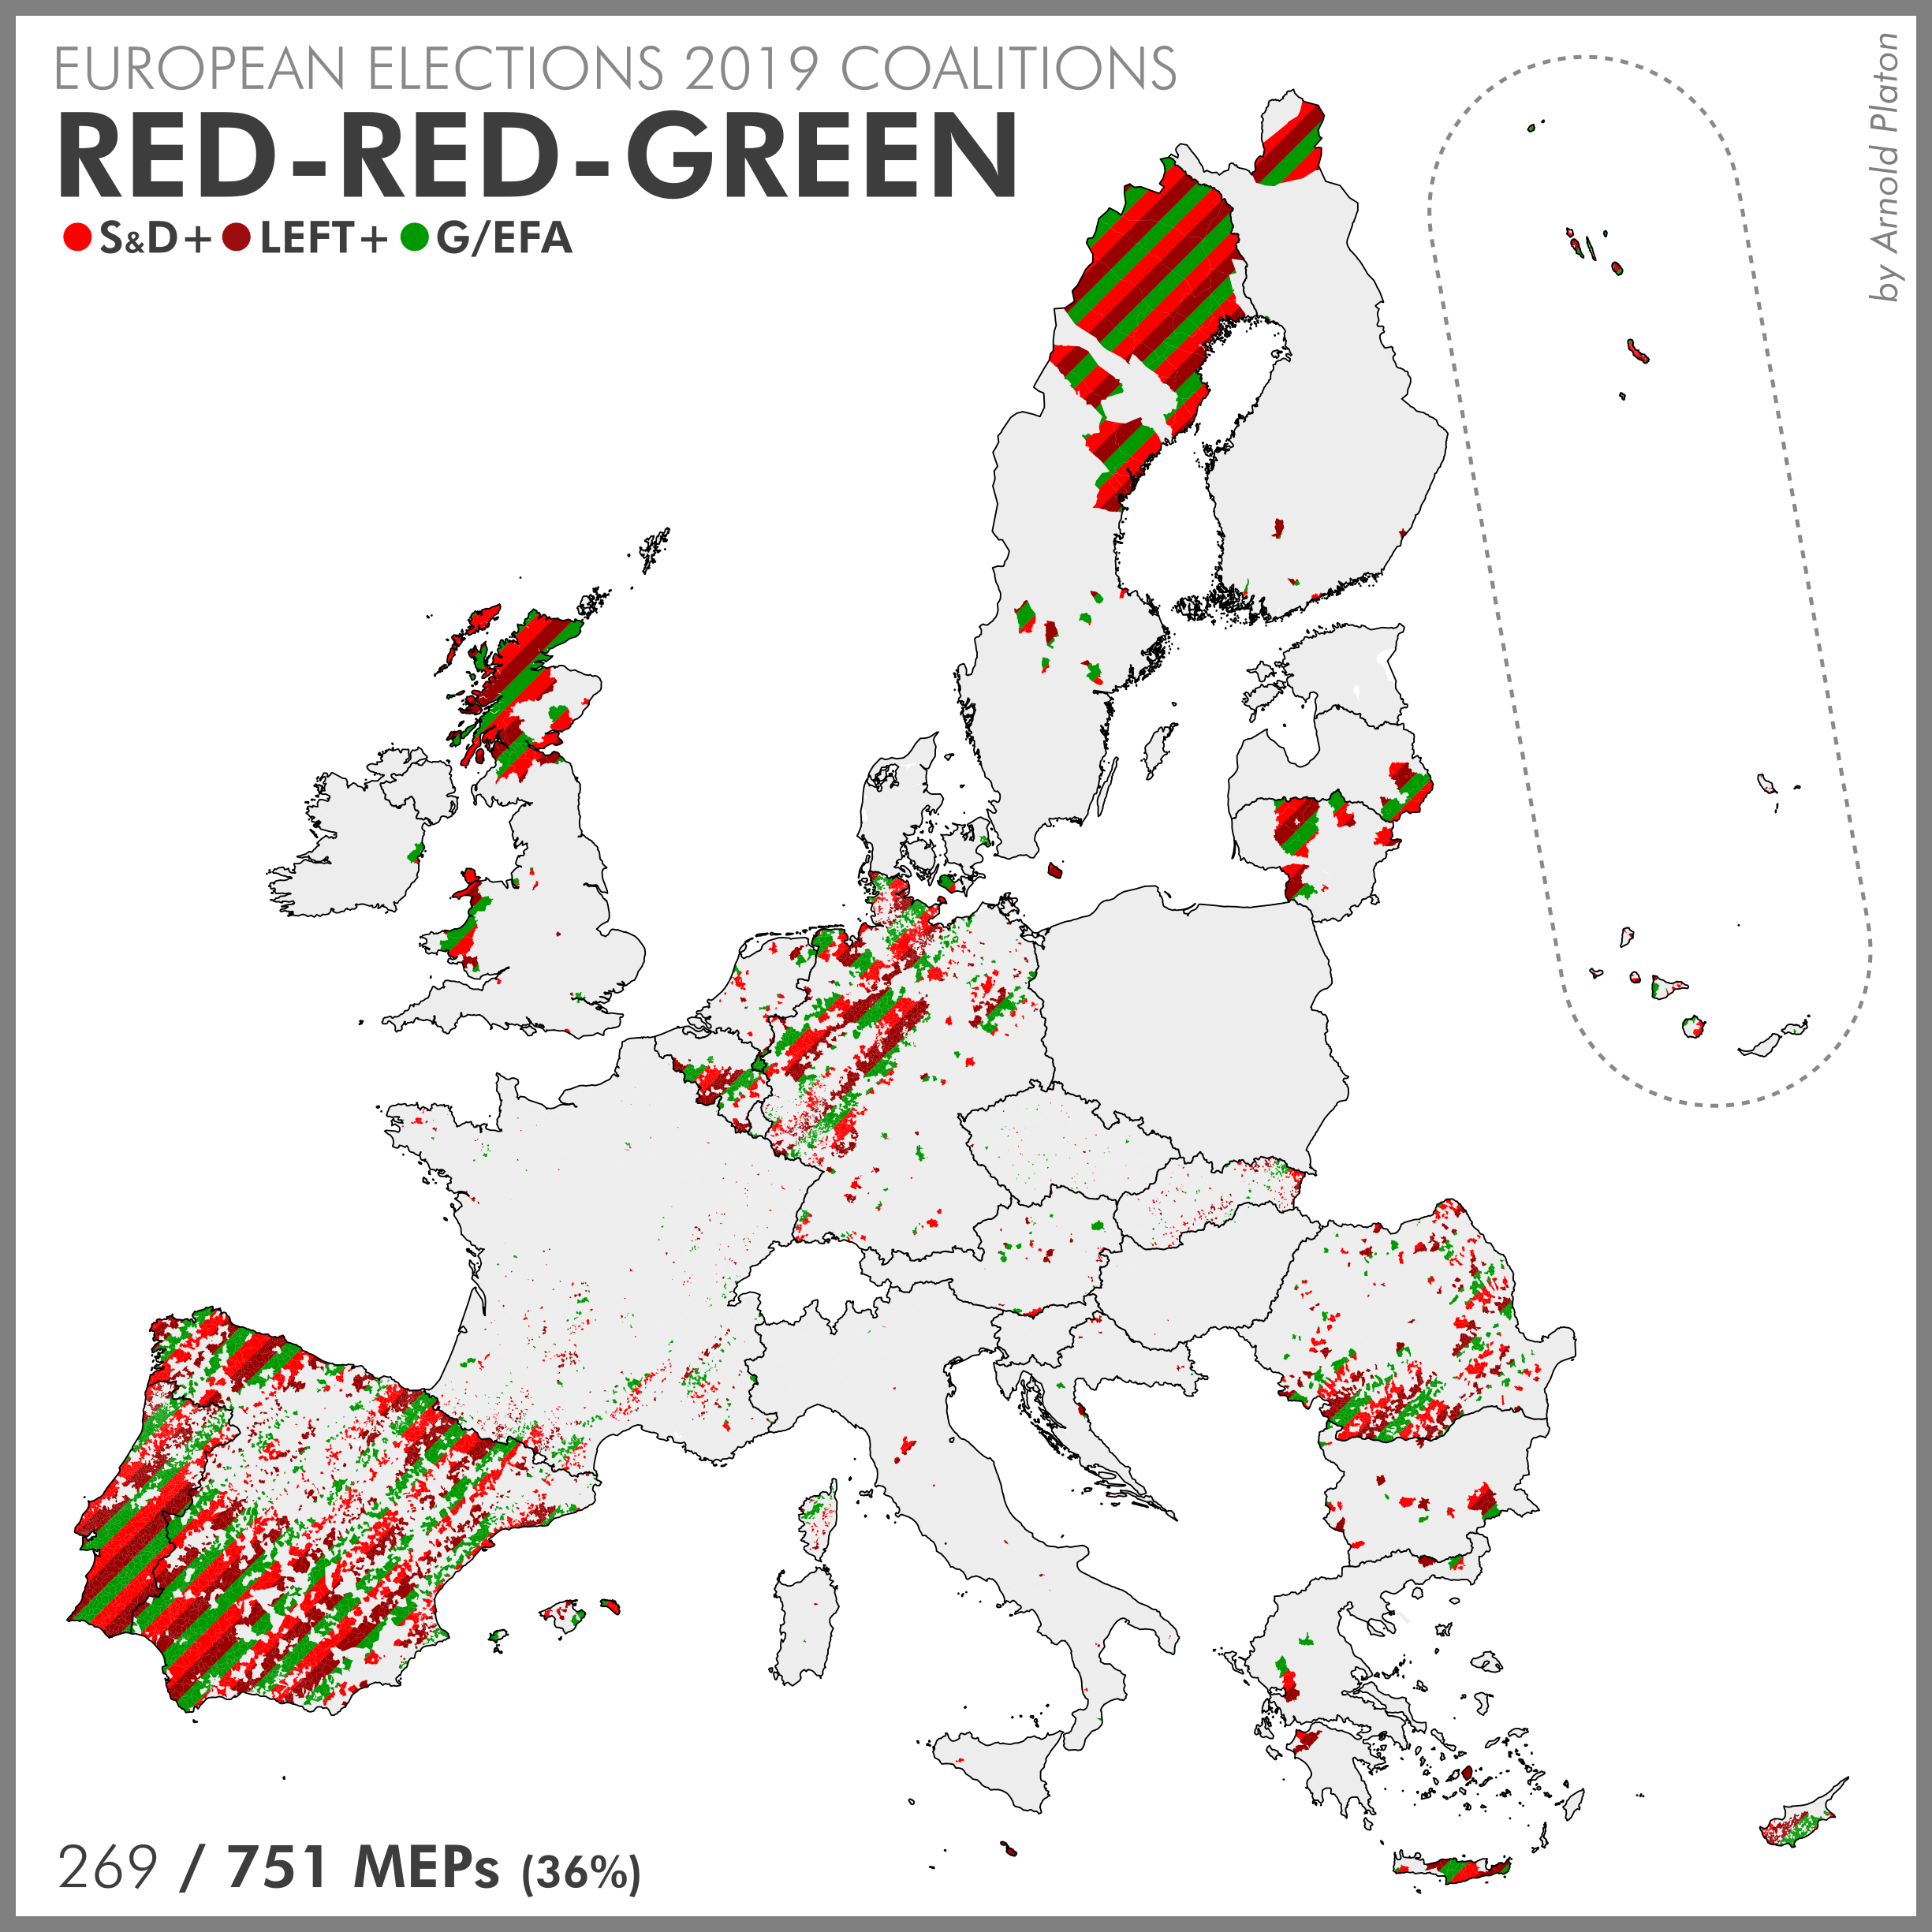
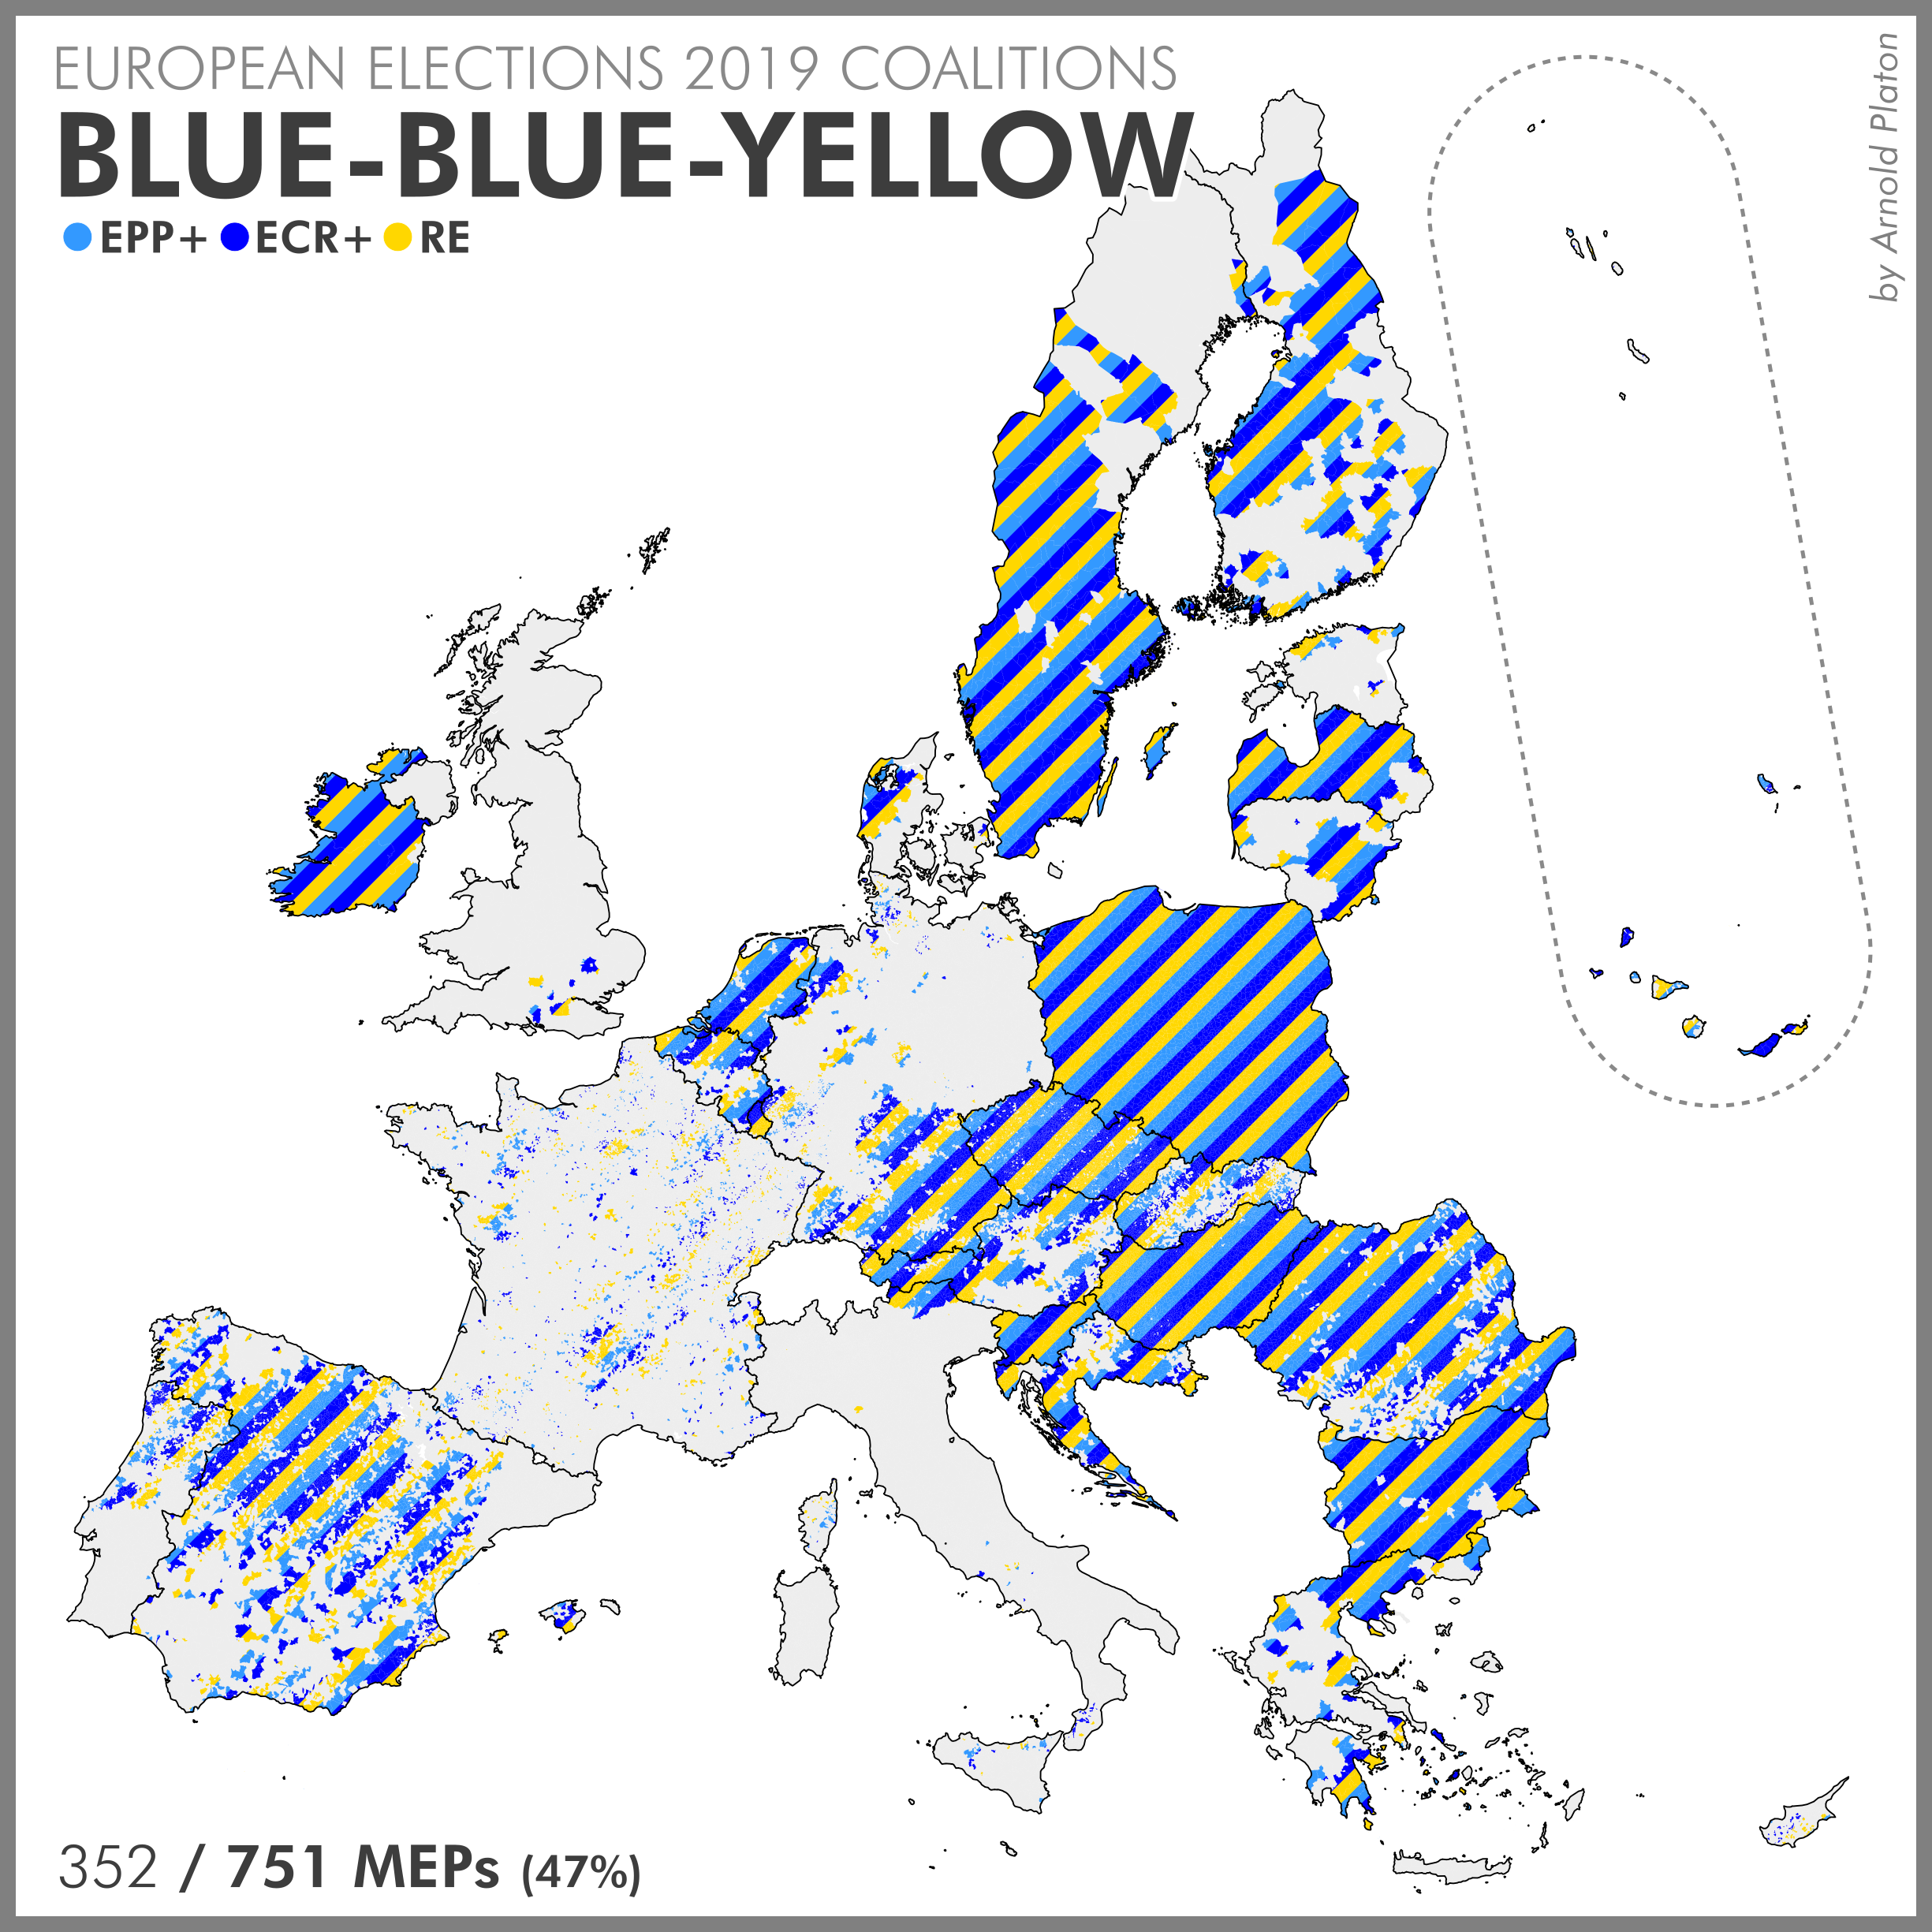
Because people in urban, suburban and rural areas often vote in slightly different ways, I decided to map the results of the 2019 European Elections split by what Eurostat calls “Degree of Urbanisation” (or “DegUrba” for short). It’s a standardized EU indicator that uses the population grid to classify Local Administrative Units, “LAU” for short, (i.e. municipalities of member states) into three types of area:

  • 1. Cities (densely populated areas)
  • 2. Towns and suburbs (intermediate density areas)
  • 3. Rural areas (thinly populated areas)

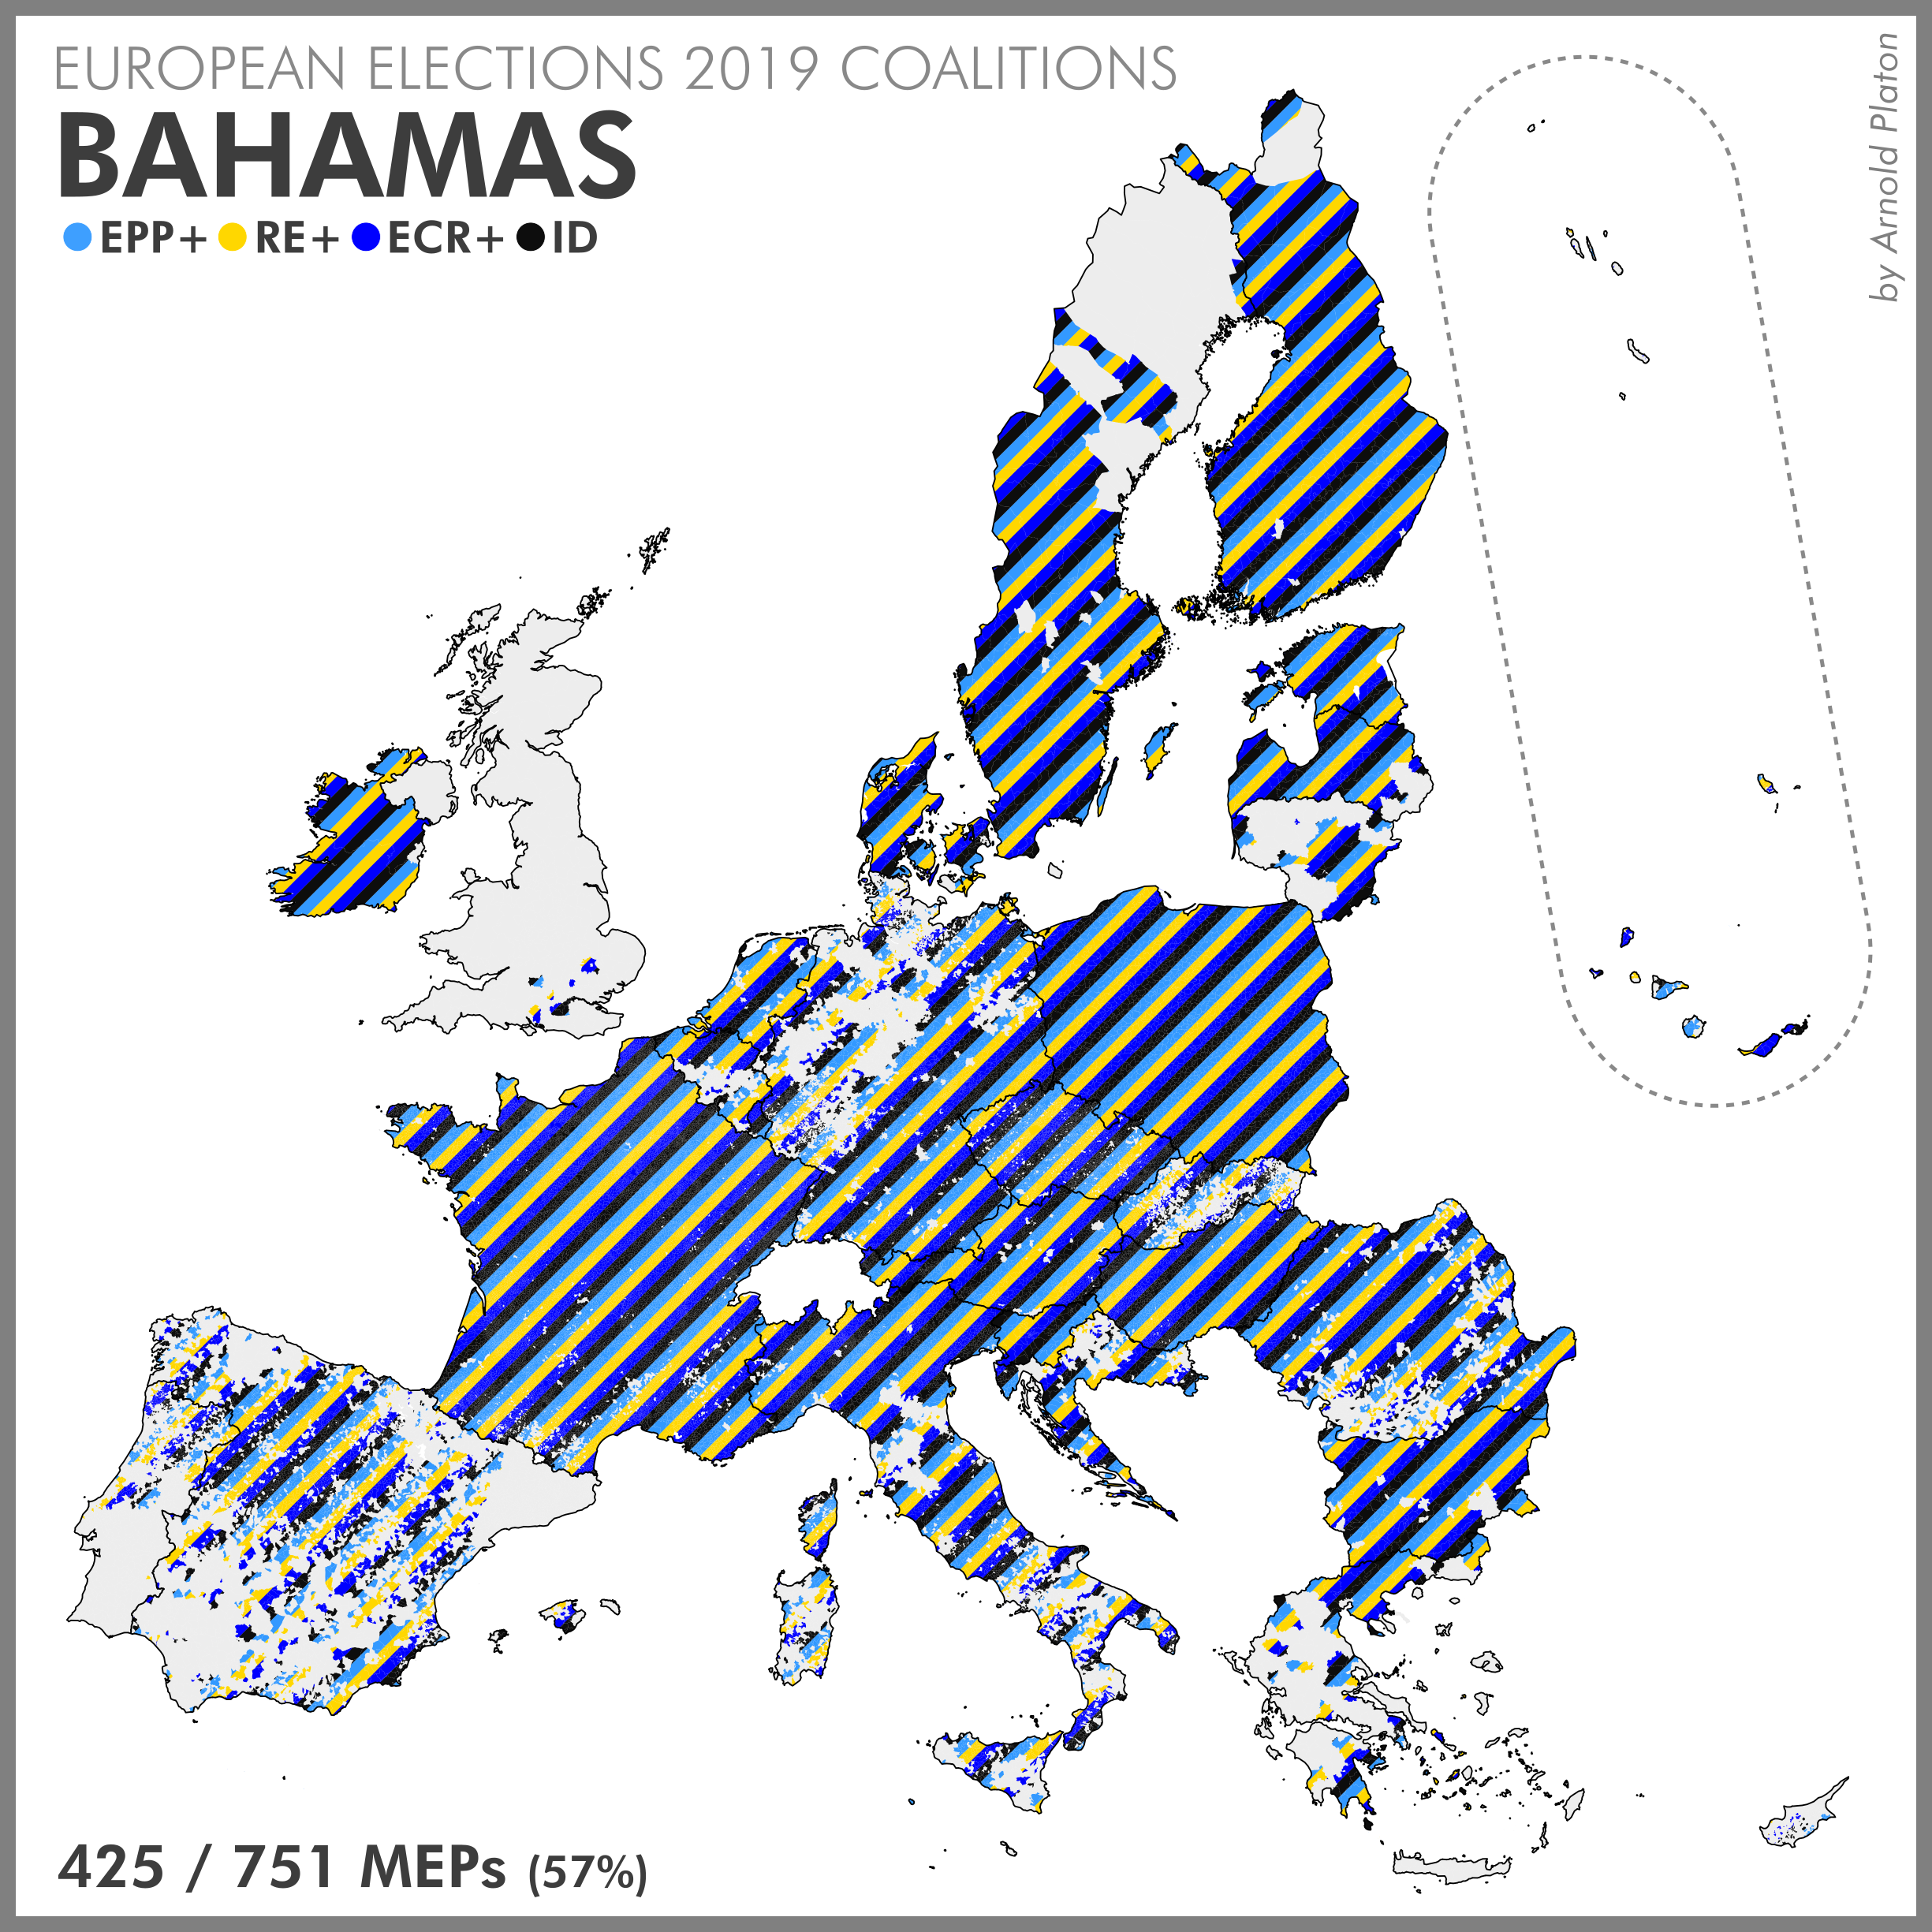
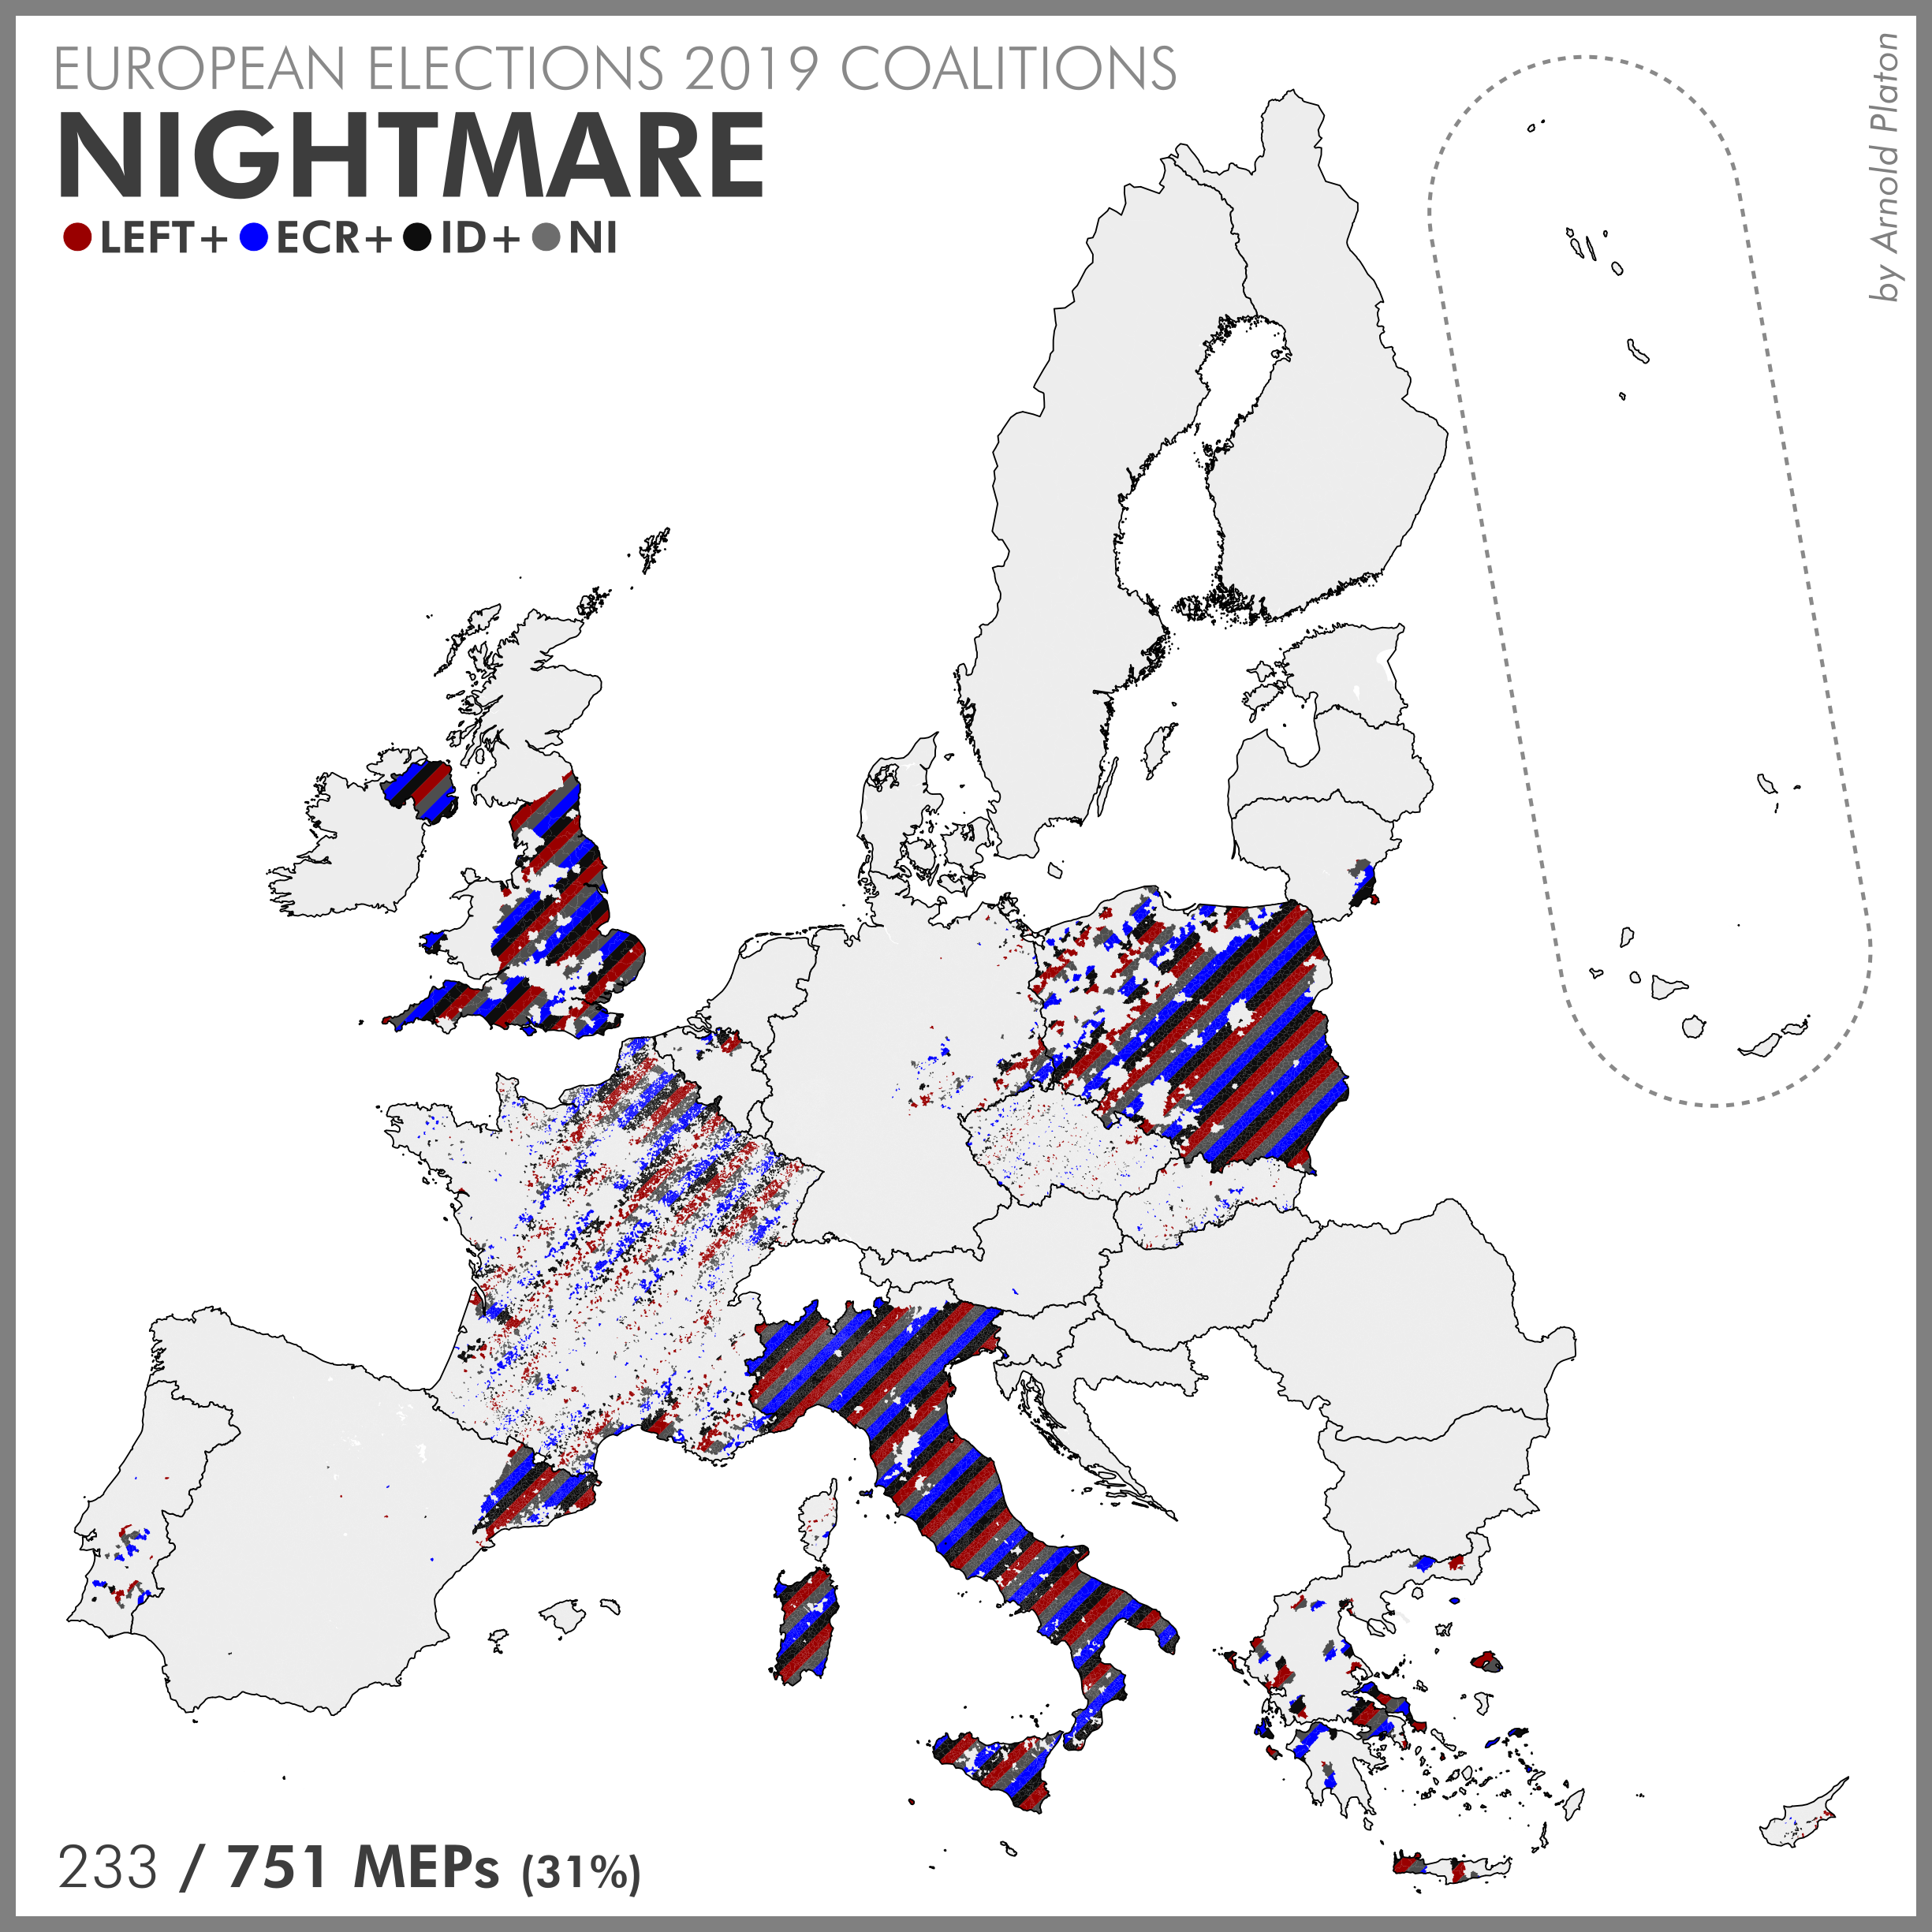
As with all of my European Election maps and visualizations, the election data is grouped by European Parliament Groups, as they were at the inaugural session of the new parliament.

Some notes on various countries and design choices:

Ireland – election data was available only by electoral constituency. This forced me to frame the visualization as a Dublin (city) versus the rest of the country (rural).

Malta & Northern Ireland (UK) – election data only available agregated for the whole country / province.

Greece – election data is available by Municipalities (325 in total) but DegUrba data is available by LAU (6133 in total, in Greece, below municipalities). I aggregated the DegUrba to Municipality level by looking at the dominant category but I’m not sure methodology is 100% watertight.

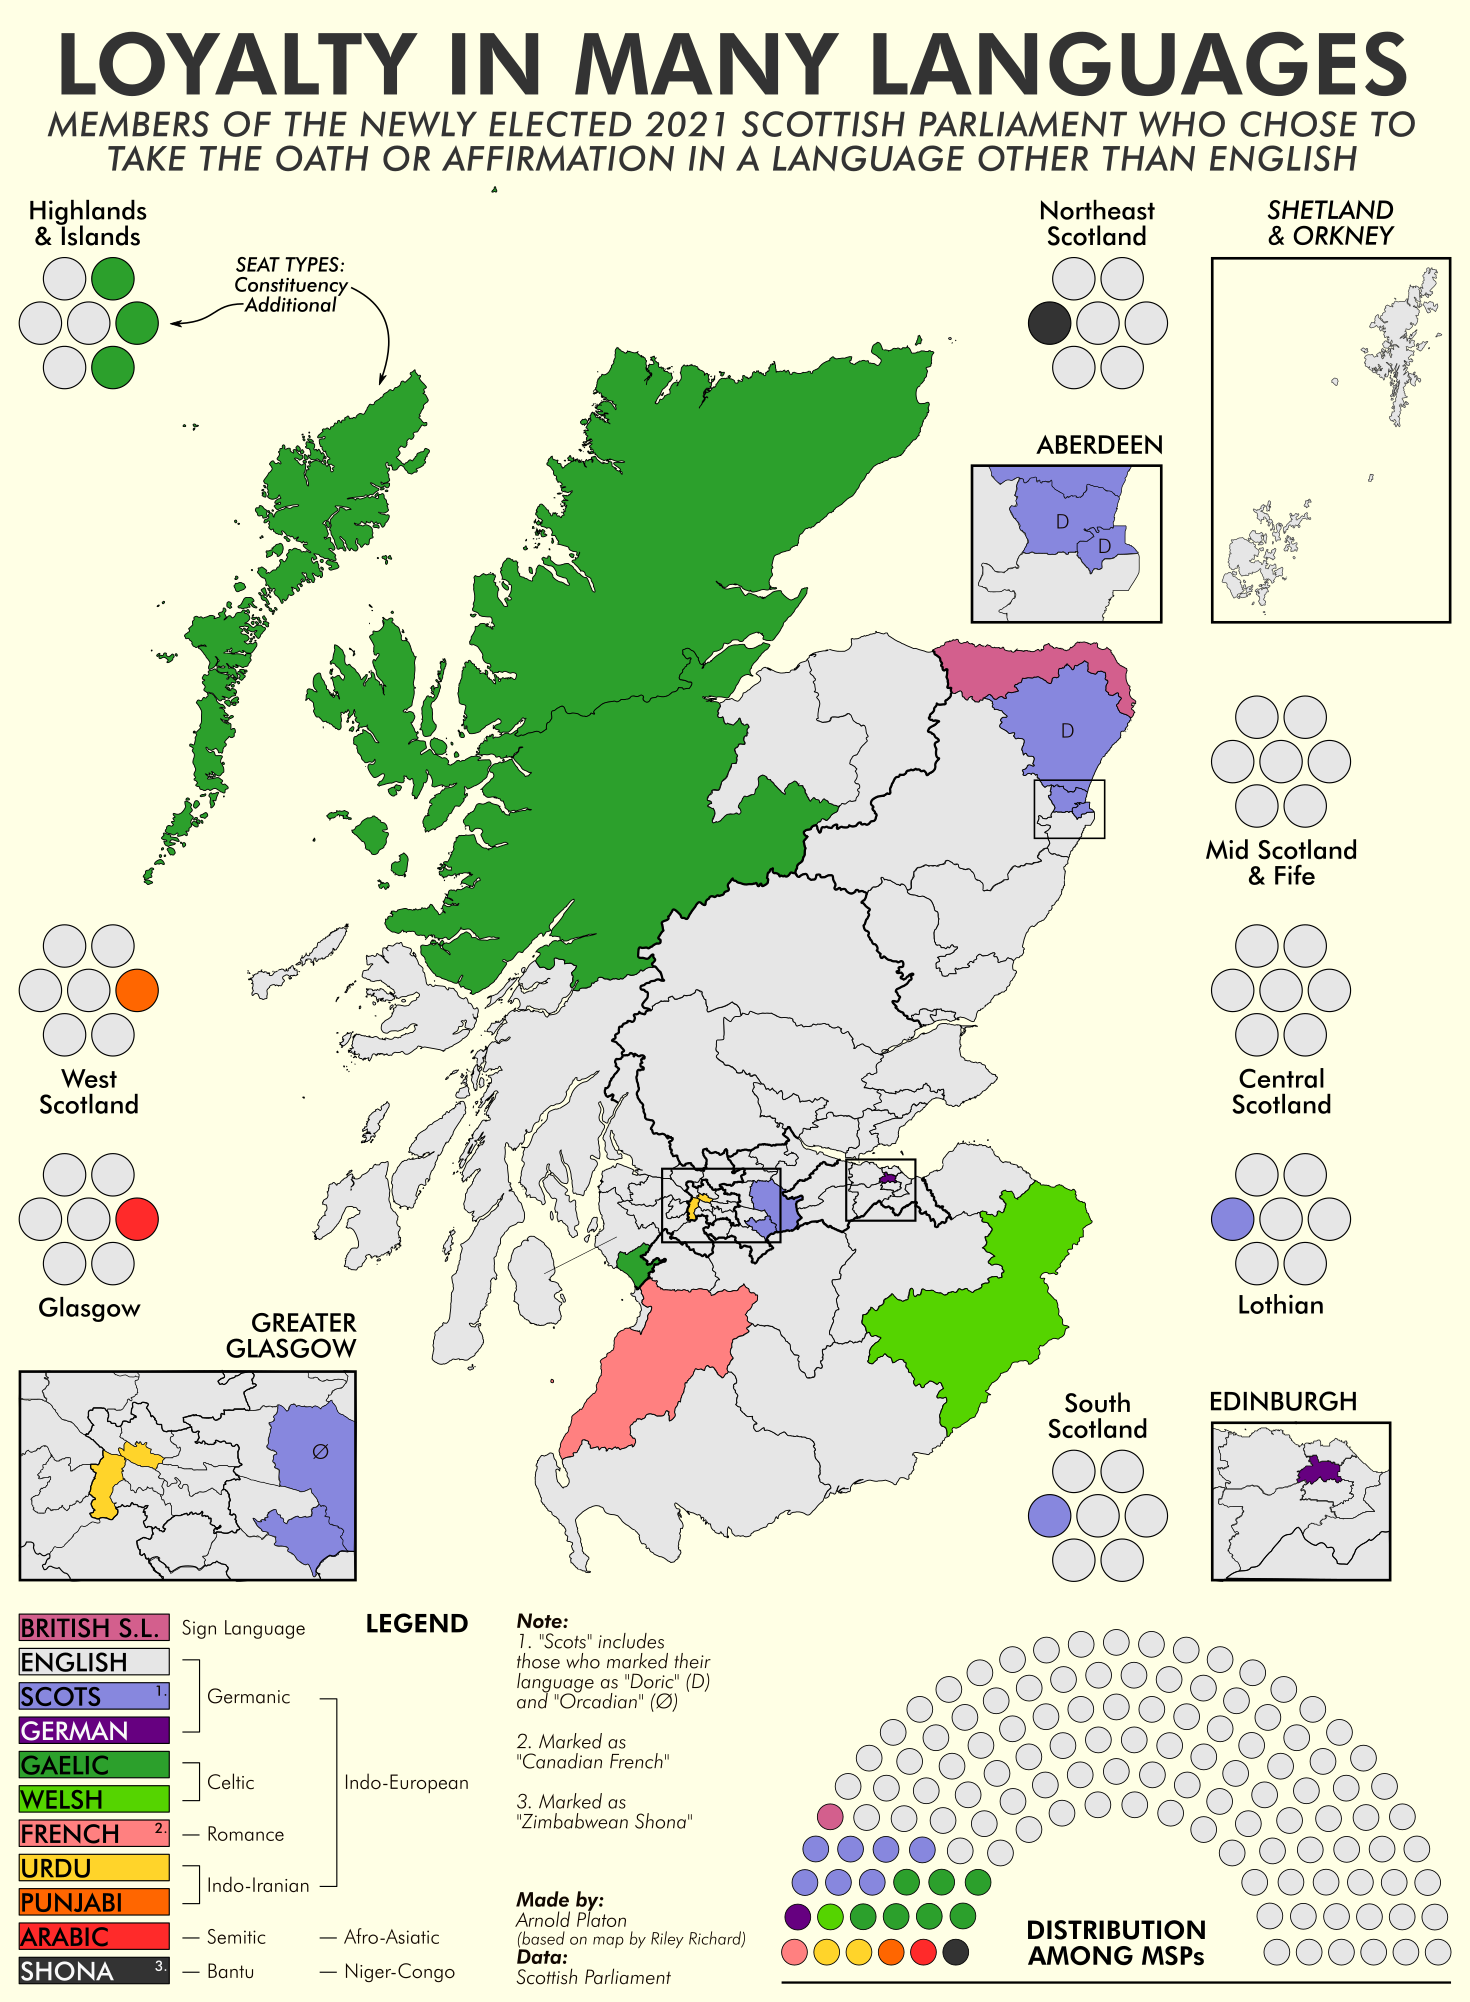
Scotland – election data by Council Areas (32) but DegUrba data by LAU (41). While about half of the LAU map onto Council areas, the rest do not, although the boundary differences aren’t that big, and I’m pretty confident the guesstimated DegUrba level is correct.

Slovenia – election data was only available by electoral constituency (88 in total) which do not map well onto municipalities. As with Greece, I used an aggregate and estimate approach.

Belgium – Since the political landscapes are so different between Flanders and Wallonia, I decided to split it by regions as well, because the country aggregate to me makes little sense.

Made with Python (Svgwrite) and Inkscape, for the “30 Day Map Challenge” of 2021 (my only contribution)

Coalitions in the European Parliament

This post is inspired by a Spiegel article from late September 2021, right after the Bundestag elections, and before the current “Ampel” ruling coalition was decided. I’ve decided to map various coalition options for the European Parliament election results of 2019 and take a look at where those coalitions would enjoy a majority of the vote share.

A bit of background: every EU Commission must enjoy the backing of a majority of the European Parliament to be elected. While European Parliament Groups are the default mode of organisation of the myriad of national parties in the union legislature, their behaviour is more loose and less disciplined compared to what we would have if we had true EU-wide parties that functioned like national parties do in national legislatures.

That being said, coalitions do exist. To make it simple: If the votes for all the parties that are part of the “coalition” (e.g. all parties members of the EPP and S&D groups in the first map below) are above 50%, then the area is colored in on the map.

The Old GroKo

The grand coalition made up of the center-right EPP group and the center-left S&D was, up until 2014, all on needed to have the majority in the European Parliament

The Chad (or Romania) Coalition

Since 2014, the EPP and S&D together have fallen under 50% of the vote share. So a new, centrist, grand coalition now exists with the inclusion of the liberal RE (formerly ALDE) group.

The Current Majority

What actually happened, when the vote for the von der Leyen commission was held, is that the EPP+S&D+RE coalition was joined by Polish PiS, Bulgarian VMRO (both ECR), Italian M5S (NI) and the SNP (G/EFA). So the actual majority for the current EU Commission is a bit wider than anticipated.

A wide centrist coalition: Mauritius

One could imagine quite easily a wider, more inclusive centrist coalition where the EPP (center-right), S&D (center-left) and RE (liberal) are joined by the G/EFA (green/regionalist) group

Traffic Light (“Ampel”) coalition

Since there was so much discussion on Germany’s “Ampel” or “traffic light” coalition, which is the one that ended up coalessiong into a government majority, below is the same center-left-green-liberal coalition on an EU level.

Neither this coalition nor the subsequent ones can muster a majority in the current parliament though…

The impossible Jamaica: a Rwanda / Gabon coalition

Because the center-right EPP is coloured blue, instead of black like the CSU/CSU, the German “Jamaica” coalition cannot function under this name and would have to be renamed to something like the Rwanda Coalition or Gabon Coalition, as both these countries’ flags are colored blue-yellow-green.

Red-Red-Green – another German classic

The “Rot-Rot-Grün” or Red-Red-Green is another classic German coalition name, that united the left, the center-left and the greens.

Blue-Blue-Yellow – the right wing answer to the Red-Red-Green

The right wing counterpart to the left leaning Red-Red-Green coalition would be, the Blue-Blue-Yellow, composed of the liberals (RE), the center-right (EPP) and the conservatives (ECR). As opposed to the coalition above, inspired by Germany, this coalition would be a purely European invention, and with a larger number of MEPs, which sort of highlights how the European Parliament leans to the right.

The Bahamas coalition

If the right wing and center-right groups above would hold their noses and include the far-right ID group into their fold, they could muster a majority akin to a Grand Coalition, but on the right.

The name comes obviously from the national flag of the Bahamas, amde up of two blue (albeit light blue) horizontal stripes, one yellow horizontal stripe, and a black chevron.

The Nightmare Coalition

The last one that I decide to map out is what I call the Nightmare Coalition. It includes the conservatives (ECR), the far-left (LEFT, formerly called GUE/NGL), the far-right (ID) and the non-inscrits (NI), which in reality is just a collection of parties that could be included in any of the above.

Fortunately, this one falls below 50%.

PS. The tweet that inspired this series of maps:

LANGUAGES IN THE STATE OF THE EUROPEAN UNION SPEECH – 2021

The languages used in the EU Commission President’s 2021 “State of the European Union” speech in context. An update from last year’s analysis.

Although fluent in French, President Ursula von der Leyen has not significantly increased the use of this language. Last year’s criticism from some quarters seem to have made little impact on her, as she still used English overwhelmingly.

She also seems, at first glance, to follow Juncker’s trajectory when it comes to speech length. First speech long (1h20m) then they become progressively shorter. In some sense it is understandable as the first SOTEU speech is also a way of introducing the presidency.

As a side-note, legth-wise, Barosso had stayed constant at about 30-40 minutes per speech throughout his mandate.

A worrying detail, is that I still see no use of any language from the EU’s Eastern half. This cannot help in countering the perception that the Eastern member states are seen, culturally too, as second-tier members. As an Eastern European I hope to see this rectified soon.

As an additional note: I took note of Jean Quatremer’s suggestion from last year and I’ve included Juncker’s and Barosso’s farewell speeches as well, even though technically they are not “State of the European Union” speeches.

Scotland – the many languages of its MSPs

The swearing in ceremony of the new Scottish Parliament on 13 May 2021 allows newly elected Members of the Scottish Parliament (MSPs) to take the oath or affirmation, in whole or in part, in another language besides English.

Some interesting geographic patterns I noticed when mapping the seats of these MSPs:

Doric, also called Mid-Northern Scots appears around Aberdeen, where one would expect to find it, Gaelic is seen mostly in the Highlands and Islands, again, due to it being the area where the majority of native speakers reside, while there seems to be two Urdu speaking MSPs in adjacent constituencies in Glasgow.

The Scots cluster in central Scotland is less well defined. Of the two constituency seats one took the oath in the Orcadian dialect of Scots, i.e. the variety spoken in Orkney, up north, and there is an additional regional MSP for Lothian, Alison Johnstone (Green), who used Scots.

A tweet below with a video showing this multilingual ceremony:

The list of languages was taken from a tweet similar to this one:

EU Elections 2019 – Dasymetric Style

The 2019 European elections mapped (by winner & turnout), using the 1km² population grid from Eurostat to exclude uninhabited areas.

Third attempt (after this and this) to take into consideration only populated areas, because “land doesn’t vote”.

This is the first time I mapped the 2019 turnout by the way. Curious what people make of it.

I had made another attempt in 2018 for the previous (2014) European elections. Then as now, Belgium was the highest and Slovakia the lowest.

For those wondering about the >100% turnout, most of those municipalities are in Romania, one in Spain. The highest, at 123% is Bara, in Timiș county, Romania. There were 262 registered voters and 322 voters showed up to vote.

In Romania, if you are in a different municipality than your own, you can vote on “extra lists” (i.e. not on the local voter registry). In some rural municipalities, if enough people are from out of town, it can bump up the numbers like this.

Now because we have 7+1 groups in the European Parliament, the “winner” does not always win a majority, only a plurality. The European People’s Party (EPP) Group, the “winner”, only got 21% of the vote.

Trying to distinguish between “majority wins” and “plurality wins” is worth exploring, but I’m not sure this version below is as readable as the original map. Still, a distinction worth keeping in mind when people talk about “winners” in the EU elections.

Winners – plurality vs. majority

I also decided to make a map with just the areas where an EP group won 50% or more of the vote, to highlight it.

Winners – by majority only

Why the UK is not exempt from the EU’s vaccine export ban

Visual highlight of why UK is not in the exemption list.

Who won here? EU Edition

Animated map showing which European parliament group won the European elections of 2019, with an increasing level of detail, going by: EU-level -> Member state -> NUTS1 -> NUTS2 -> NUTS3 -> Municipalities or Constituencies -> (repeat)

Inspired by Lisa Charlotte Rost’s article on the Datawrapper blog titled Different levels, different patterns.

Made with QGIS and Inkscape.

EU NUTS3 labels – Asian style

Inspired by a 1594 map of China (see further down), and East Asian style vertical labeling in general, I tried my hand at an EU map with vertical labels.

Inspired by this tweet and map (direct link):

Made with QGIS qnd Inkscape.

A new Europe with lasting Peace (A Remake)

For the 17th day of the 30 Day Map Challenge I tried my hand at a modern remake of the 1920 map “A new Europe with lasting Peace” adapted to the extent of today’s Flag of European Union European Union, with most slices preserved as in the original.

I have tried to make a version that would have been centered on Brussels but it was too eccentric so I kept Vienna as the capital.

For those unfamiliar, the original map by P.A.M. that served as an inspiration is posted below. Follow this link for a detailed description.

The flag is based on the now famous, and much hated, “barcode flag” by Dutch architecture firm OMA. Follow this link for more.

The 8-pointed star is from a 1954 proposal for a European flag by Arsène Heitz. See more proposals on Wikipedia.